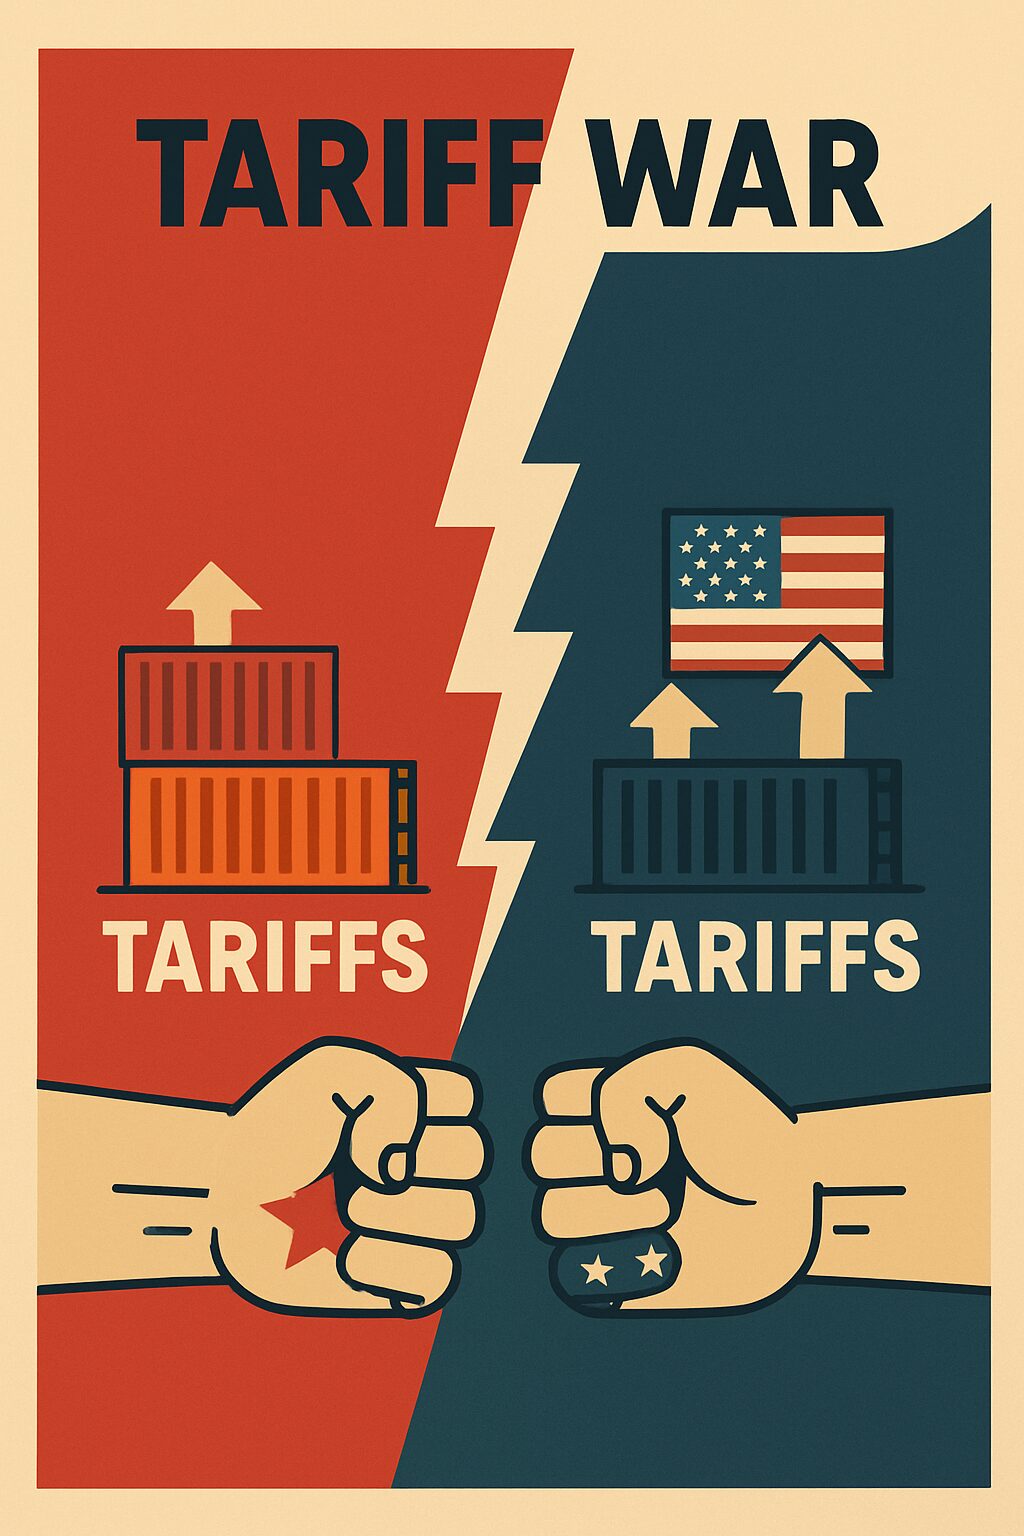
The Impact of Tariffs on Industrial Automation


Industrial automation has become a cornerstone of modern manufacturing, driving efficiency, productivity, and competitiveness. However, the increasing use of tariffs—taxes imposed on imported goods—has introduced new complexities for businesses relying on automation technologies. While tariffs aim to protect domestic industries, they can also disrupt supply chains, increase costs, and slow innovation in industrial automation. This article explores the effects they have on the automation sector.

Read more: The Impact of Tariffs on Industrial Automation

What Are Tariffs?

There exists the misconception that tariffs are a tax on exporters. However, that simply isn’t true. A tariff is an import tax that gets put upon the importing company not the exporting company. Typically the importing party pays the tariff then in turn passes the cost of the onto their customers by marking up the price of the goods imported in.


How Tariffs Affect Industrial Automation

1. Increased Costs for Automation Components

Many industrial automation systems rely on imported components, such as robotic arms, sensors, controllers, and motors. When tariffs are imposed on these goods, manufacturers face higher procurement costs. For example, U.S. tariffs on Chinese-made automation parts have forced companies to either absorb the extra expenses or pass them on to customers, leading to higher prices for automated systems.

2. Supply Chain Disruptions

Tariffs can disrupt global supply chains by making certain suppliers less competitive. Companies that depend on just-in-time manufacturing may struggle with delays and shortages if they must switch suppliers due to tariff-related cost increases. This can slow down automation adoption as businesses face uncertainty in sourcing critical components.

3. Slowdown in Automation Adoption

Small and medium-sized enterprises (SMEs) that are considering automation may delay investments due to higher costs from tariffs. This could slow overall productivity growth in manufacturing, as automation is a key driver of efficiency.

4. Encouragement of Domestic Production

On the positive side, tariffs may incentivize companies to produce automation components locally. Countries imposing tariffs often aim to boost domestic manufacturing, which could lead to increased investment in homegrown automation technologies. However, building a competitive local supply chain takes time and may not immediately offset the negative effects of tariffs.

5. Trade Wars and Long-Term Uncertainty

Ongoing trade tensions, such as those between the U.S. and China, create uncertainty for automation suppliers and manufacturers. Companies may hesitate to make long-term investments in automation if trade policies remain unpredictable.

Are There Advantages to Tariffs?

While tariffs are generally looked down upon for their disruption to the flow in the global economy. When used responsibly and with proper domestic infrastructure in place, tariffs do have certain advantages.

Reshoring of Manufacturing

Companies may bring production back to domestic markets, increasing demand for localized automation solutions.

Innovation in Alternative Technologies

Higher costs for imported components could accelerate the development of new automation technologies that rely less on tariff-affected parts.

Strategic Sourcing Diversification

Businesses may seek suppliers in countries not subject to tariffs, leading to a more resilient supply chain.

Conclusion

Tariffs can present obstacles and potential opportunities for industrial automation. While they raise costs and disrupt supply chains, they may also encourage domestic production and innovation. Companies in the automation sector must adapt by diversifying suppliers, investing in local manufacturing, and exploring new technologies to mitigate risks. Policymakers should also consider their long-term impacts on industrial competitiveness, ensuring that trade policies support—rather than hinder—technological advancement.

As automation continues to transform manufacturing, navigating trade-related challenges will be crucial for sustaining growth and maintaining a competitive edge in the global market.


Are You In Need of A Replacement Drive?

Tariffs may present themselves as an obstacle, but don’t let a broken drive or motor slow you down. Do you need to replace your drive quickly and efficiently? Let our team of experts help you get your operation back up and running.

Updated on May 1, 2025 by Ken Cheng

Title graphic for a study about the U.S. states with the sorest losers

States With the Sorest Losers [2025 Survey]

Some sports fans take a loss in stride, while others…not so much. Whether it’s blaming the refs, talking trash even after the final whistle, or full-blown meltdowns, certain states’ sports fans just feel a defeat more deeply. With high-stakes games and bracket-busting upsets fueling emotions this time of year, the intensity is at an all-time high.

To find out which states have the sorest losers, we surveyed over 2,100 sports fans nationwide, asking them about the sportsmanship—and not-so-sportsmanlike reactions—of fans in their state. The results reveal which states take losses way harder than others.

States Most & Least Likely to Be Sore Losers

We surveyed sports fans across 44 U.S. states, asking 10 questions to gauge their level of sportsmanship, competitiveness, and just how hard they take a big loss. The survey measured everything from trash-talking habits to how often fans blame the refs, whether they’ve been called a sore loser, and even how frequently fights break out during games. Each question was answered on a 1-to-5 scale, with 5 indicating a higher likelihood of sore loser behavior. We then averaged the responses and indexed them into a final sore loser score out of 100 for each state—with higher final scores signaling states where taking an “L” hits the hardest.

These are the five states with the sorest losers, and their respective sore loser scores (out of 100):

  1. Alabama93.4
  2. Pennsylvania84.1
  3. Massachusetts68.1
  4. New Jersey 67.7
  5. West Virginia66.5

When it comes to taking a loss very personally, no one does it quite like Alabama. Topping the list with a sore loser score of 93.4, Alabama sports fans bring an unmatched level of passion to every matchup. And when the scoreboard doesn’t go their way? Let’s just say they feel it. More than half of Alabamians (51%) admit to having a total meltdown after a big loss—the only state in the survey where this was the most common reaction. And if you’ve ever heard “the refs blew it!” echoing through an Alabama bar or living room, that checks out too: 33% say they “almost always” blame losses on bad calls, while 41% say they do it “often.” What’s more, 43% of Alabama respondents say they’ve witnessed a sports fan throw a tantrum after a loss more times than they can count.

That intensity isn’t just reserved for college rivalries—it starts early. Alabama parents bring just as much energy to the sidelines of youth sports. A quarter of Alabama respondents (25%) say parents in their state “almost always” get too worked up at kids’ sporting events, while 37% admit they do so “often.” Whether it’s a Saturday in Bryant-Denny or a little league game in Birmingham, one thing is clear: Alabama takes its sports very seriously.

Trailing behind but still bringing the drama are Pennsylvania, Massachusetts, New Jersey, and West Virginia—all states where sports are treated with near-religious devotion. When asked, “Which best describes your state’s sports fanbase?” Pennsylvania respondents were the most likely to choose “We talk trash before and after the game, win or lose”—a sentiment shared by nearly 60% of them. And that competitive spirit doesn’t always go unnoticed. Half of Pennsylvania respondents admit they’ve been called a sore loser at least once or twice, while in neighboring New Jersey, 45% of respondents say the same. 

Over in Massachusetts, nearly half of respondents say sports are taken “extremely seriously—every game feels like a big deal.” But if you’re looking for high-intensity matchups, West Virginia might take the crown. More than half (54%) of respondents in the state have witnessed a fight break out during a game they were playing in. And the passion starts early—15% of West Virginia respondents say parents in their state “almost always” get too worked up at kids’ sporting events, while 38% say it happens “often.”

On the opposite end of the spectrum, these are the five states least likely to be sore losers, and their respective sore loser scores (out of 100):

  1. Oregon11.8
  2. Idaho16.5
  3. Arizona24.7
  4. Maine30.8
  5. Minnesota31.6

Some states accept losses with a bit more grace than others. According to survey results, Oregon is the least likely state to be full of sore losers, with a sore loser score of just 11.8. And the numbers back it up: 56% of Oregonians have never been called a sore loser, and when their team takes a big loss, 67% say they’re unbothered or don’t care at all, simply shrugging it off with an “it’s just a game” mentality. Even trash talk is kept to a minimum—a third (33%) rarely or never talk smack after a loss. And if you’re looking for sports parents who keep their cool, Oregon is the place to be. Not a single respondent said parents in their state “almost always” get too worked up at kids’ sporting events, and only 13% said it happens “often.”

Arizona and Idaho also rank among the least sore loser-prone states, with nearly half of respondents (48% in AZ, 47% in ID) saying they’ve never been called a sore loser. Idaho, in particular, leads the nation in sportsmanship—32% say they’ve never seen a fan throw a tantrum after a loss, the highest percentage of any state. Meanwhile, over in Maine, 64% of respondents say sports fans there don’t dwell on losses, and in Minnesota, 63% describe their fanbase as “passionate but mostly respectful.” Minnesotans also keep their cool in the heat of the game—67% say fights during games almost never break out, while another 20% say it’s rare.

Full State-by-State Ranking

Curious about where your state ranks? Our interactive table below breaks down the full survey results, showing the most common answers for all 10 sore loser-focused questions in each state. You can search for your state or sort by different categories to see which fanbases take losses the hardest—and which ones truly let it go.

Closing Thoughts

At the end of the day, some states take sports losses harder than others—and our survey proves it. Alabama, Pennsylvania, and Massachusetts top the list as the sorest losers, where fans are more likely to blame the refs, talk trash after a loss, and even witness full-blown meltdowns. Meanwhile, Oregon, Idaho, and Arizona keep things cool, proving that not every fanbase lets a tough defeat ruin their day. Whether your state lives for the thrill of competition or takes an “it’s just a game” approach, one thing is clear: sports bring out strong emotions, win or lose.

Just like sports fans rely on their teams to show up and perform, businesses rely on industrial automation systems to keep things running smoothly—because downtime is never an option. At MRO Electric, we specialize in repairing and supplying industrial automation components, helping businesses maintain peak performance even under pressure. Get in touch with us today to keep your operations running at championship level.

Methodology 

To find the states with the sorest losers, we conducted a survey of 2,196 U.S. sports fans across 44 states. The survey ran over a one-week period, from February 12 to February 19, 2025. Alaska, Montana, North Dakota, South Dakota, Vermont, and Wyoming were excluded from the survey due to limited survey respondents in those states.

For the state ranking portion of our study, we evaluated states across 10 key survey questions that reflect sore loser behaviors, ultimately measuring how sports fans in each state react after a big loss. Questions included their level of trash talk, tendency to blame referees, frequency of being called sore losers, and how often they witness fights during games, among others. Each question was answered on a 1-to-5 scale, with 5 indicating a higher likelihood of sore loser behavior. We then averaged the responses and indexed them into a final sore loser score out of 100 for each state—with higher final scores signaling states most likely to be sore losers.

Updated on April 22, 2025 by Leanna Cota

Three-Phase Power

Three-phase power remains a widely used method for generating, transmitting, and distributing electricity. It is more efficient than single-phase and is the backbone of industrial and commercial electrical systems. This article explores the history of three-phase and its most common applications today.

Read more: Three-Phase Power

How Three-Phase Power Works

Three-phase power consists of three alternating currents (phases) spaced 120 degrees apart. This
arrangement ensures a constant energy delivery, unlike single-phase systems, which have energy
fluctuations. Key advantages include:

  • Higher Efficiency
    • Requires less conductor material compared to single-phase for the same power output.
  • Smoother Power Delivery
    • Ideal for running large motors without interruptions.
  • Flexibility
    • Can power both industrial equipment and residential areas by splitting phases.

History

Before three-phase power, electrical systems primarily used direct current (DC) or single-phase alternating current (AC). Thomas Edison promoted DC power, while Nikola Tesla and George Westinghouse advocated for AC due to its ability to transmit electricity over long distances. In 1887 Tesla developed the first AC induction motor. This motor was capable of both two and three phase. Tesla’s work demonstrated that three-phase systems were more efficient for energy transmission and motor operation.

In 1891, the first long-distance three-phase power transmission became demonstrated at the International Electrotechnical Exhibition in Frankfurt, Germany. Engineers Dolivo-Dobrovolsky, Mikhail Osipovich, and Charles Eugene Lancelot Brown successfully transmitted 175 kW of power over 175 km with minimal losses, proving the superiority of three-phase AC. The success of this demonstration paved the way for modern three-phase and by the early 20th century, three-phase power became the standard for industrial and commercial power distribution. This was primarily due to its efficiency, reliability, and ability to power large motors.

Example of first three-phase motor by Tesla.
The Tesla Polyphase was the first example of a three phase motor.

Most Common Uses for Three-Phase Power

Since its inception in the 1800’s, three-phase power has seen itself used in a wide variety of industries and applications. It sees the most use in the industrial sector. Factories use three-phase to run heavy equipment such as pumps and conveyor systems without voltage drop. You can read more information about three-phase and AC Motors in the industrial sector here.

In the commercial sector, like shopping centers, hospitals, and office, three-phase power gets used in HVAC systems to keep the buildings habitable all year long. The renewable energy sector sees three-phase being generated and fed back into the energy grid.

Three-phase power also finds a more direct to consumer use as well. It gets used to power data centers all over the world. The computational power of these server require stable high capacity voltage which three-phase excels in providing. As of late, three-phase has found their use in the electric vehicle industry being used at charging stations for people to charge their vehicles.

Conclusion

Three-phase power revolutionized electrical engineering with its efficiency and reliability. From its origins in Tesla’s innovations to its widespread use in industry and infrastructure, three-phase systems remain the standard for high-energy applications. As technology advances, three-phase will continue to play a crucial role in modern energy systems.


Updated on April 2, 2025 by Ken Cheng