Whether you’re building sprawling starships or intricate architectural replicas, Lego sets have become a go-to creative escape for builders of all ages. At MRO Electric, we’re builders and problem-solvers at heart, so we were curious which sets were capturing the most attention nationwide. To find out, we analyzed Google Trends search data from the past 12 months, comparing interest levels for the 50 best-selling Lego sets across all 50 states.
The results reveal a colorful mix of fan-favorite franchises and ambitious display pieces that continue to spark imagination years after their initial release. Whether residents gravitated toward massive builds like the Eiffel Tower or pop-culture favorites like the Millennium Falcon, every state had a standout Lego set that captured its interest.
Each State’s Top-Searched Lego Set
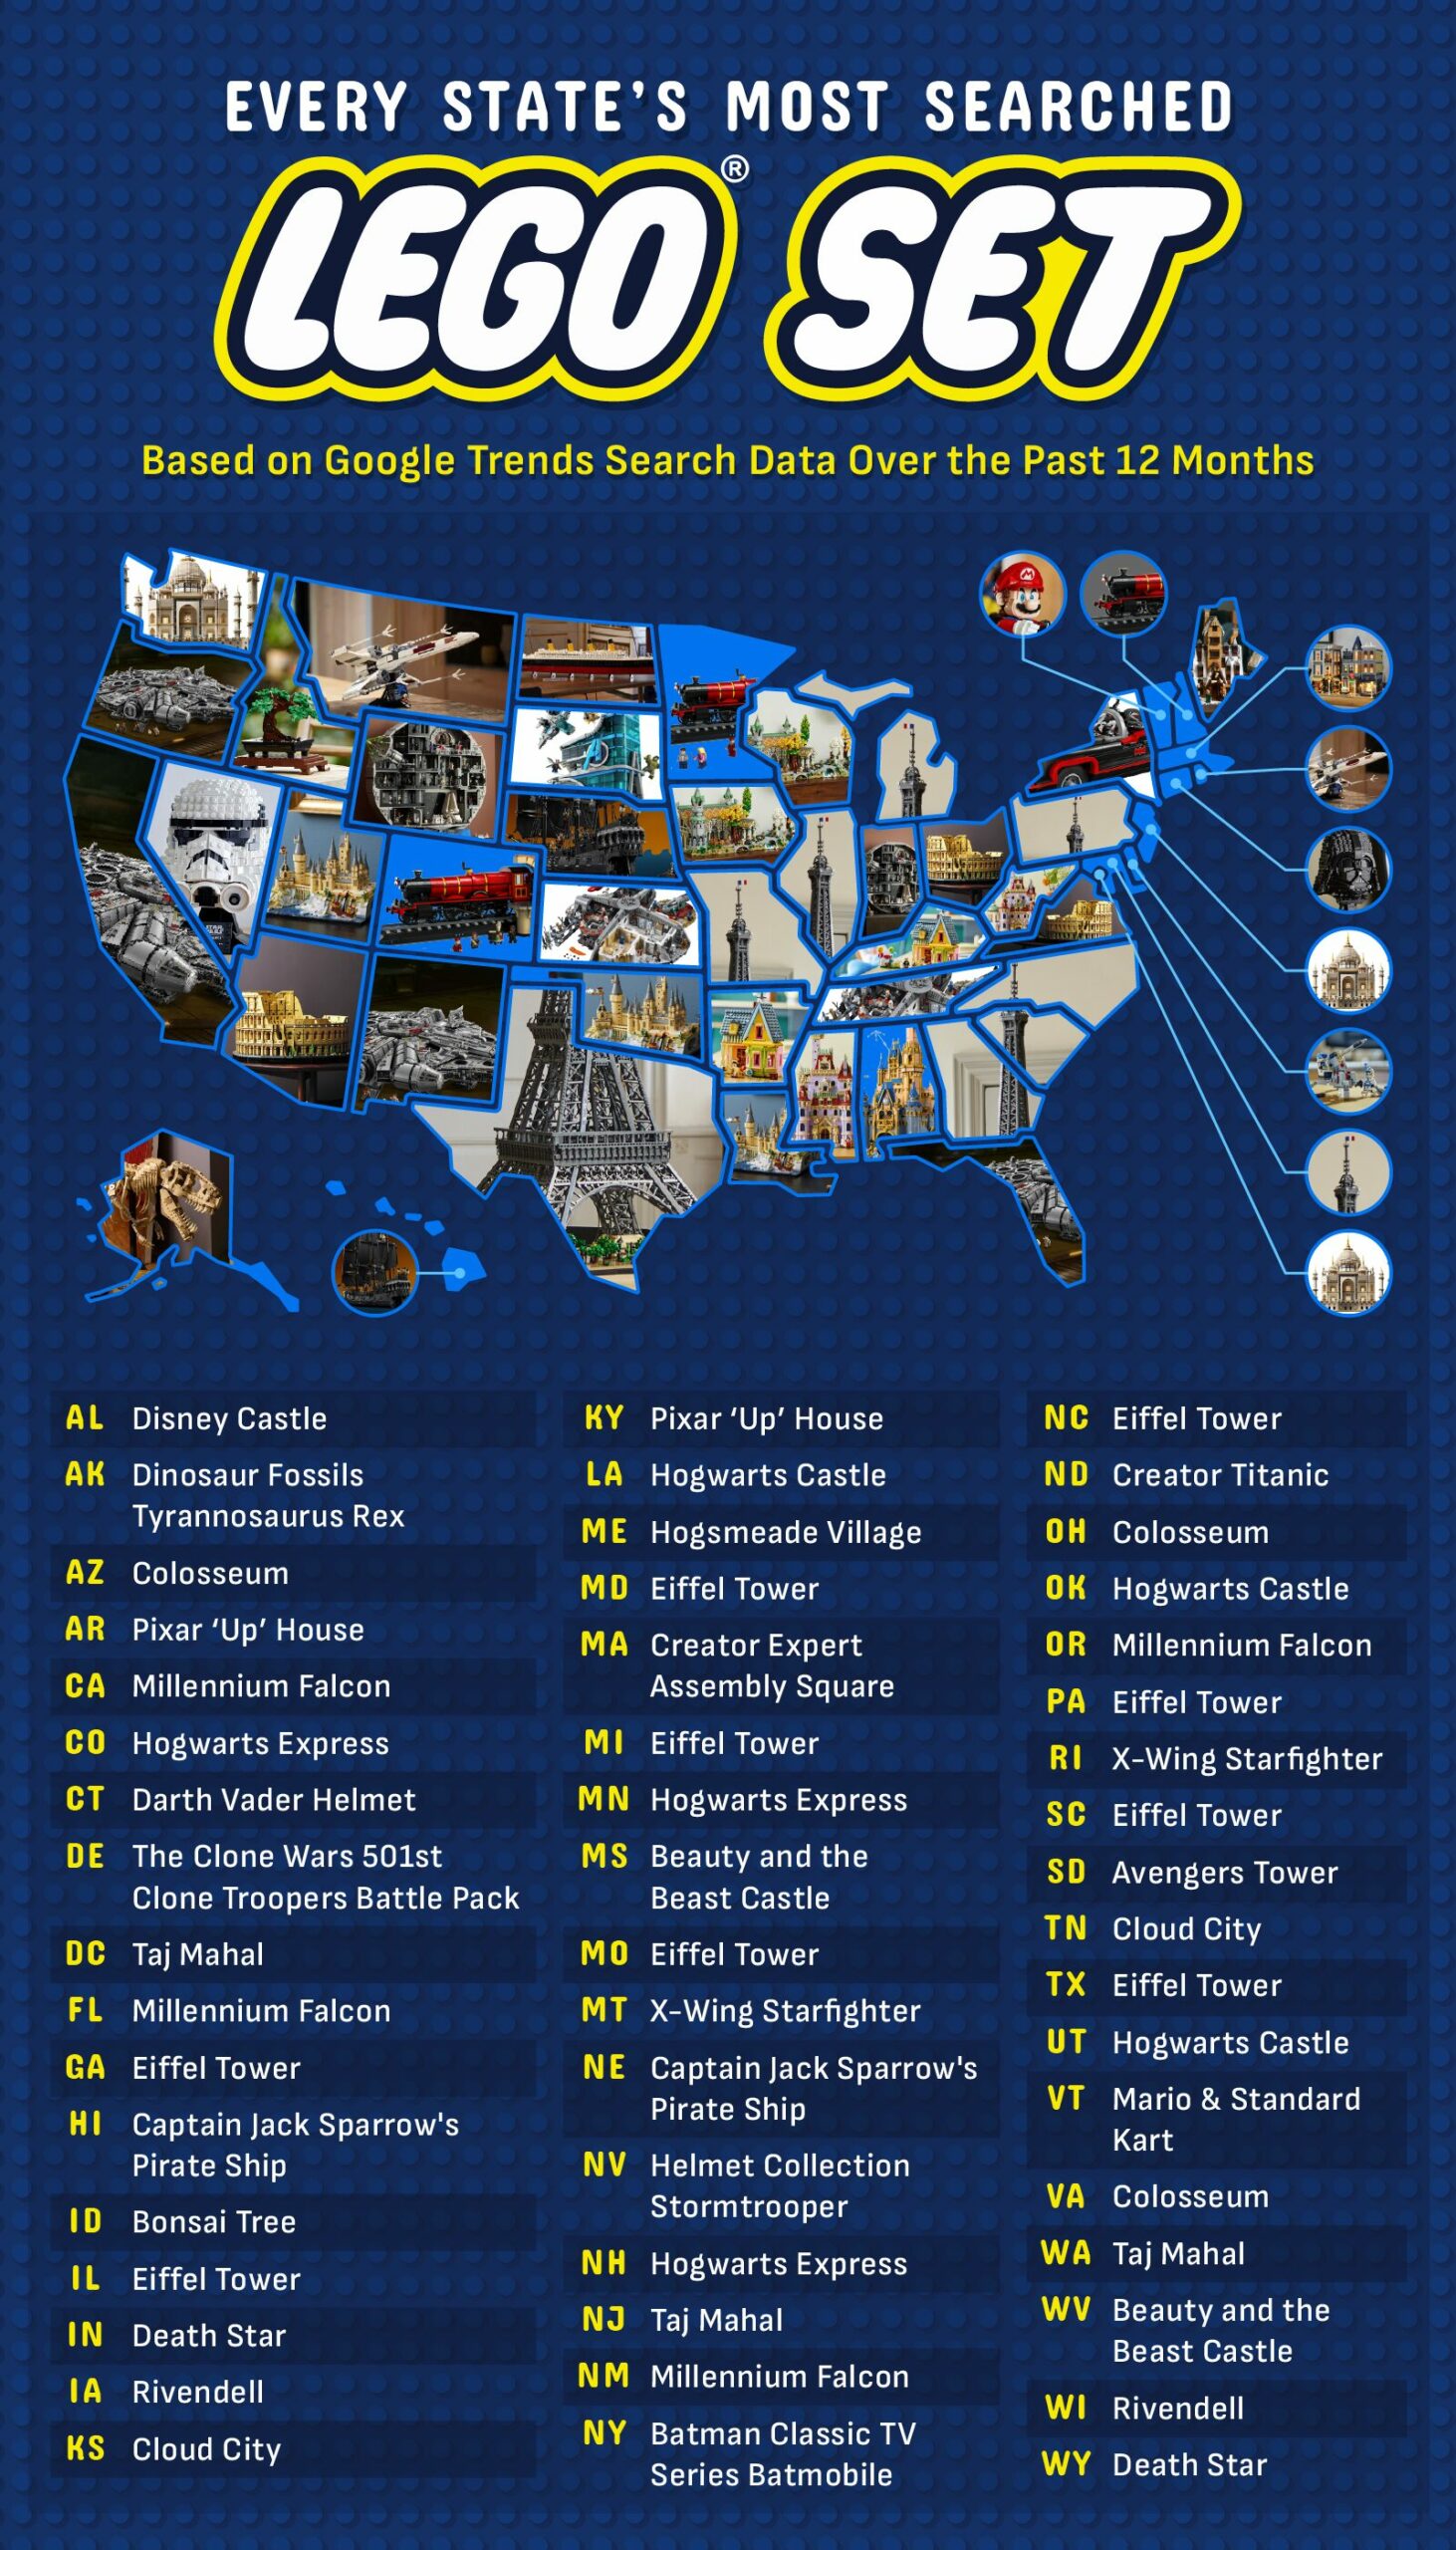
Across the country, regional preferences reveal clear patterns in the types of Lego sets Americans most often searched for. Star Wars emerged as a major force in many western and southwestern states, with searches centering on iconic builds like the Lego Millennium Falcon and the Lego Death Star. Sets like Cloud City also stood out, showing the franchise’s widespread appeal in states with large fan conventions and strong sci-fi communities.
In contrast, the Northeast and Mid-Atlantic regions showed a strong affinity for the Lego Architecture line, with many states in these regions favoring builds like the Lego Eiffel Tower and the Lego Colosseum. This regional cluster suggests an appreciation for large-scale display pieces, particularly in states where urban centers and design-focused culture may inspire interest in detailed architectural models.
Meanwhile, Harry Potter maintained a devoted following in pockets across the country. Fans in Colorado, Minnesota, and New Hampshire searched most for the Lego Hogwarts Express, while Louisiana, Oklahoma, and Utah showed a strong preference for the Lego Hogwarts Castle. Maine leaned toward the Lego Hogsmeade Village, highlighting how different chapters of the franchise resonate uniquely with local fans.
The South displayed some of the most varied interests. Alabama favored the Lego Disney Castle, while Arkansas and Kentucky gravitated toward the whimsical Lego Pixar “Up” House. Mississippi and West Virginia stood out for their searches for the Lego Beauty and the Beast Castle, adding to Disney’s strong footprint in the region.
A few states chose clear outliers: Idaho residents searched most for the iconic Lego Bonsai Tree, part of the Botanical Collection, while Vermont favored the Lego Mario & Standard Kart set. North Dakota stood alone in favor of the Lego Titanic set, and both Hawaii and Nebraska showed the most interest in Lego Captain Jack Sparrow’s Pirate Ship, a standout favorite within the Pirates of the Caribbean franchise.
The Eiffel Tower and Millennium Falcon are the Most Popular Lego Sets Overall
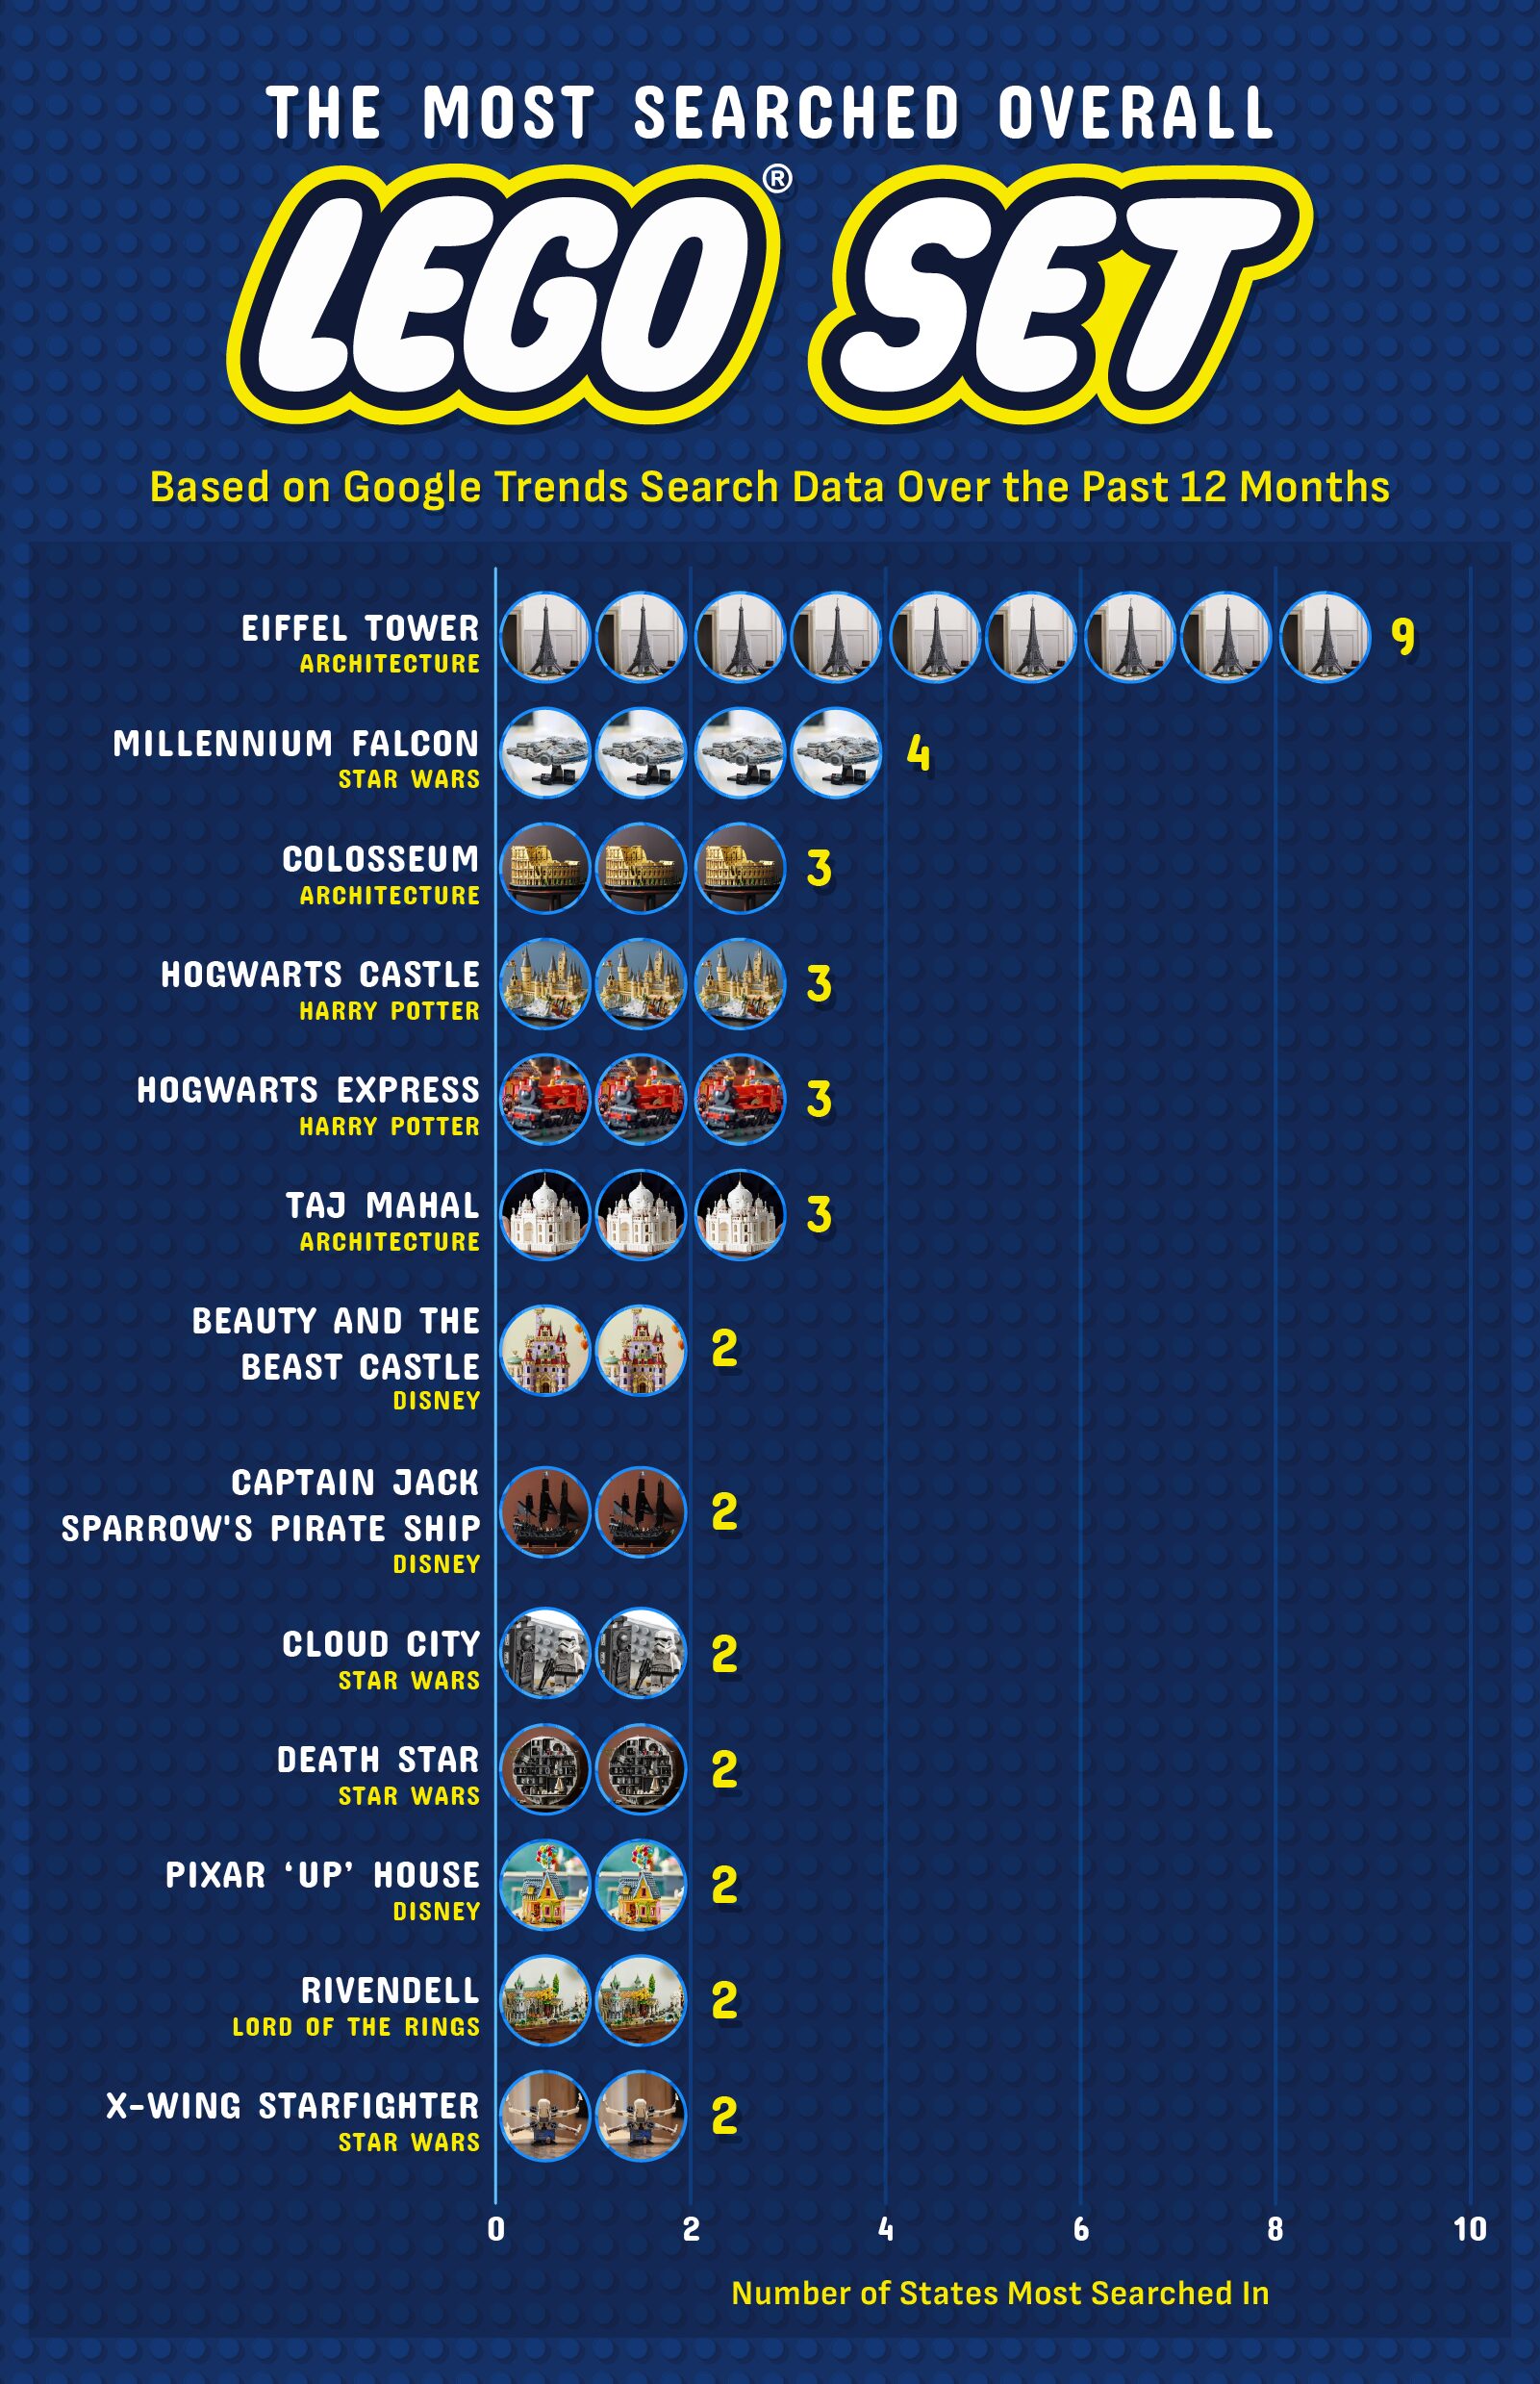
The most popular Lego sets in the U.S., overall, are:
- Lego Eiffel Tower — Lego Architecture: topped 9 states
- Lego Millennium Falcon — Star Wars: 4 states
- Lego Colosseum — Lego Architecture: 3 states
- Lego Hogwarts Castle — Harry Potter: 3 states
- Lego Hogwarts Express — Harry Potter: 3 states
- Lego Taj Mahal — Lego Architecture: 3 states
The clear nationwide favorite is the Lego Eiffel Tower, released in 2022, which ranked as the most-searched set in nine states, the highest total of any build in the dataset. As one of Lego’s tallest and most intricate display pieces (and with a retail price of $629.99), its popularity reflects the growing demand for large, architecturally inspired sets that double as décor.
In second place is the iconic Lego Millennium Falcon from Star Wars, the top search in four states. A longtime favorite among collectors, this flagship remains one of Lego’s most recognizable sets and one of its priciest, with the UCS version retailing at $849.99. Lego has released several versions of the Millennium Falcon set since 2000.
Just behind it are four sets tied for third place: the Lego Colosseum, Lego Hogwarts Castle ($469.99), Lego Hogwarts Express, and Lego Taj Mahal, each leading searches in three states. These builds blend fantasy and real-world landmarks, showing how both imaginative worlds and historical icons capture builders’ attention.
Rounding out the list are seven sets tied for fourth place, each topping searches in two states. These include Disney favorites like the Lego Beauty and the Beast Castle and the Lego Pixar “Up” House, Star Wars builds such as Lego Cloud City, Lego Death Star, and Lego X-Wing Starfighter, as well as standouts like Lego Rivendell and Lego Captain Jack Sparrow’s Pirate Ship.
Closing Thoughts
Whether it’s the architectural precision of the Eiffel Tower, the cinematic nostalgia of the Death Star, or the cozy charm of the house from Pixar’s “Up,” Americans gravitate toward sets that reflect their imaginations, interests, and sense of escape.
And just as Lego builders rely on sturdy foundations and precise engineering to bring their creations to life, manufacturers and engineers depend on reliable systems to keep their operations running. At MRO Electric, we help ensure those systems stay strong by repairing and supplying high-quality industrial automation components — including drives, PLCs, HMIs, and more — from trusted brands featured in our full product catalog. If you’re ready to strengthen your system’s performance, contact us today.
Methodology
We identified each state’s most popular Lego set by analyzing Google Trends search data from the past 12 months across all 50 states and the District of Columbia. Using a list of 50 of the most-owned and best-selling Lego sets, we compared search interest for each and selected the set with the highest relative search volume in each state.
Sources Used to Compile Lego Set Search Terms:
Fair Use
You are welcome to use, reference, and share non-commercial excerpts of this study with proper attribution. If you cite or cover our findings, please link back to this page so readers can view the full methodology, charts, and context.