Through industrial automation, manufacturing has come a long way. The leaps and bounds in speed, precision, safety, and overall efficiency has vastly improved from earlier industrial age. One of the attributions to this success easily goes to the teach pendant. The invention of this handheld controller has allowed operators to program and troubleshoot a lot of problems with ease. In this article, we explore the role of teach pendants in automation, their key features, and their impact on modern manufacturing.
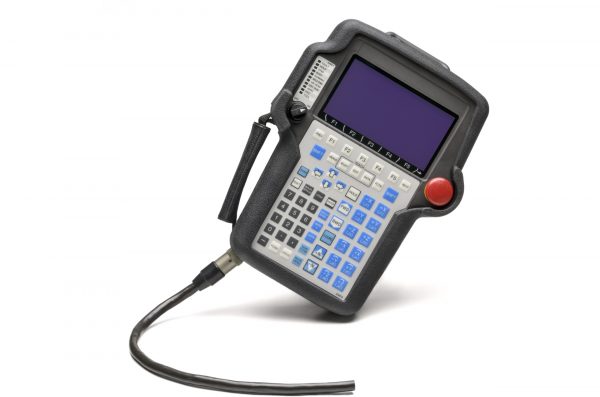
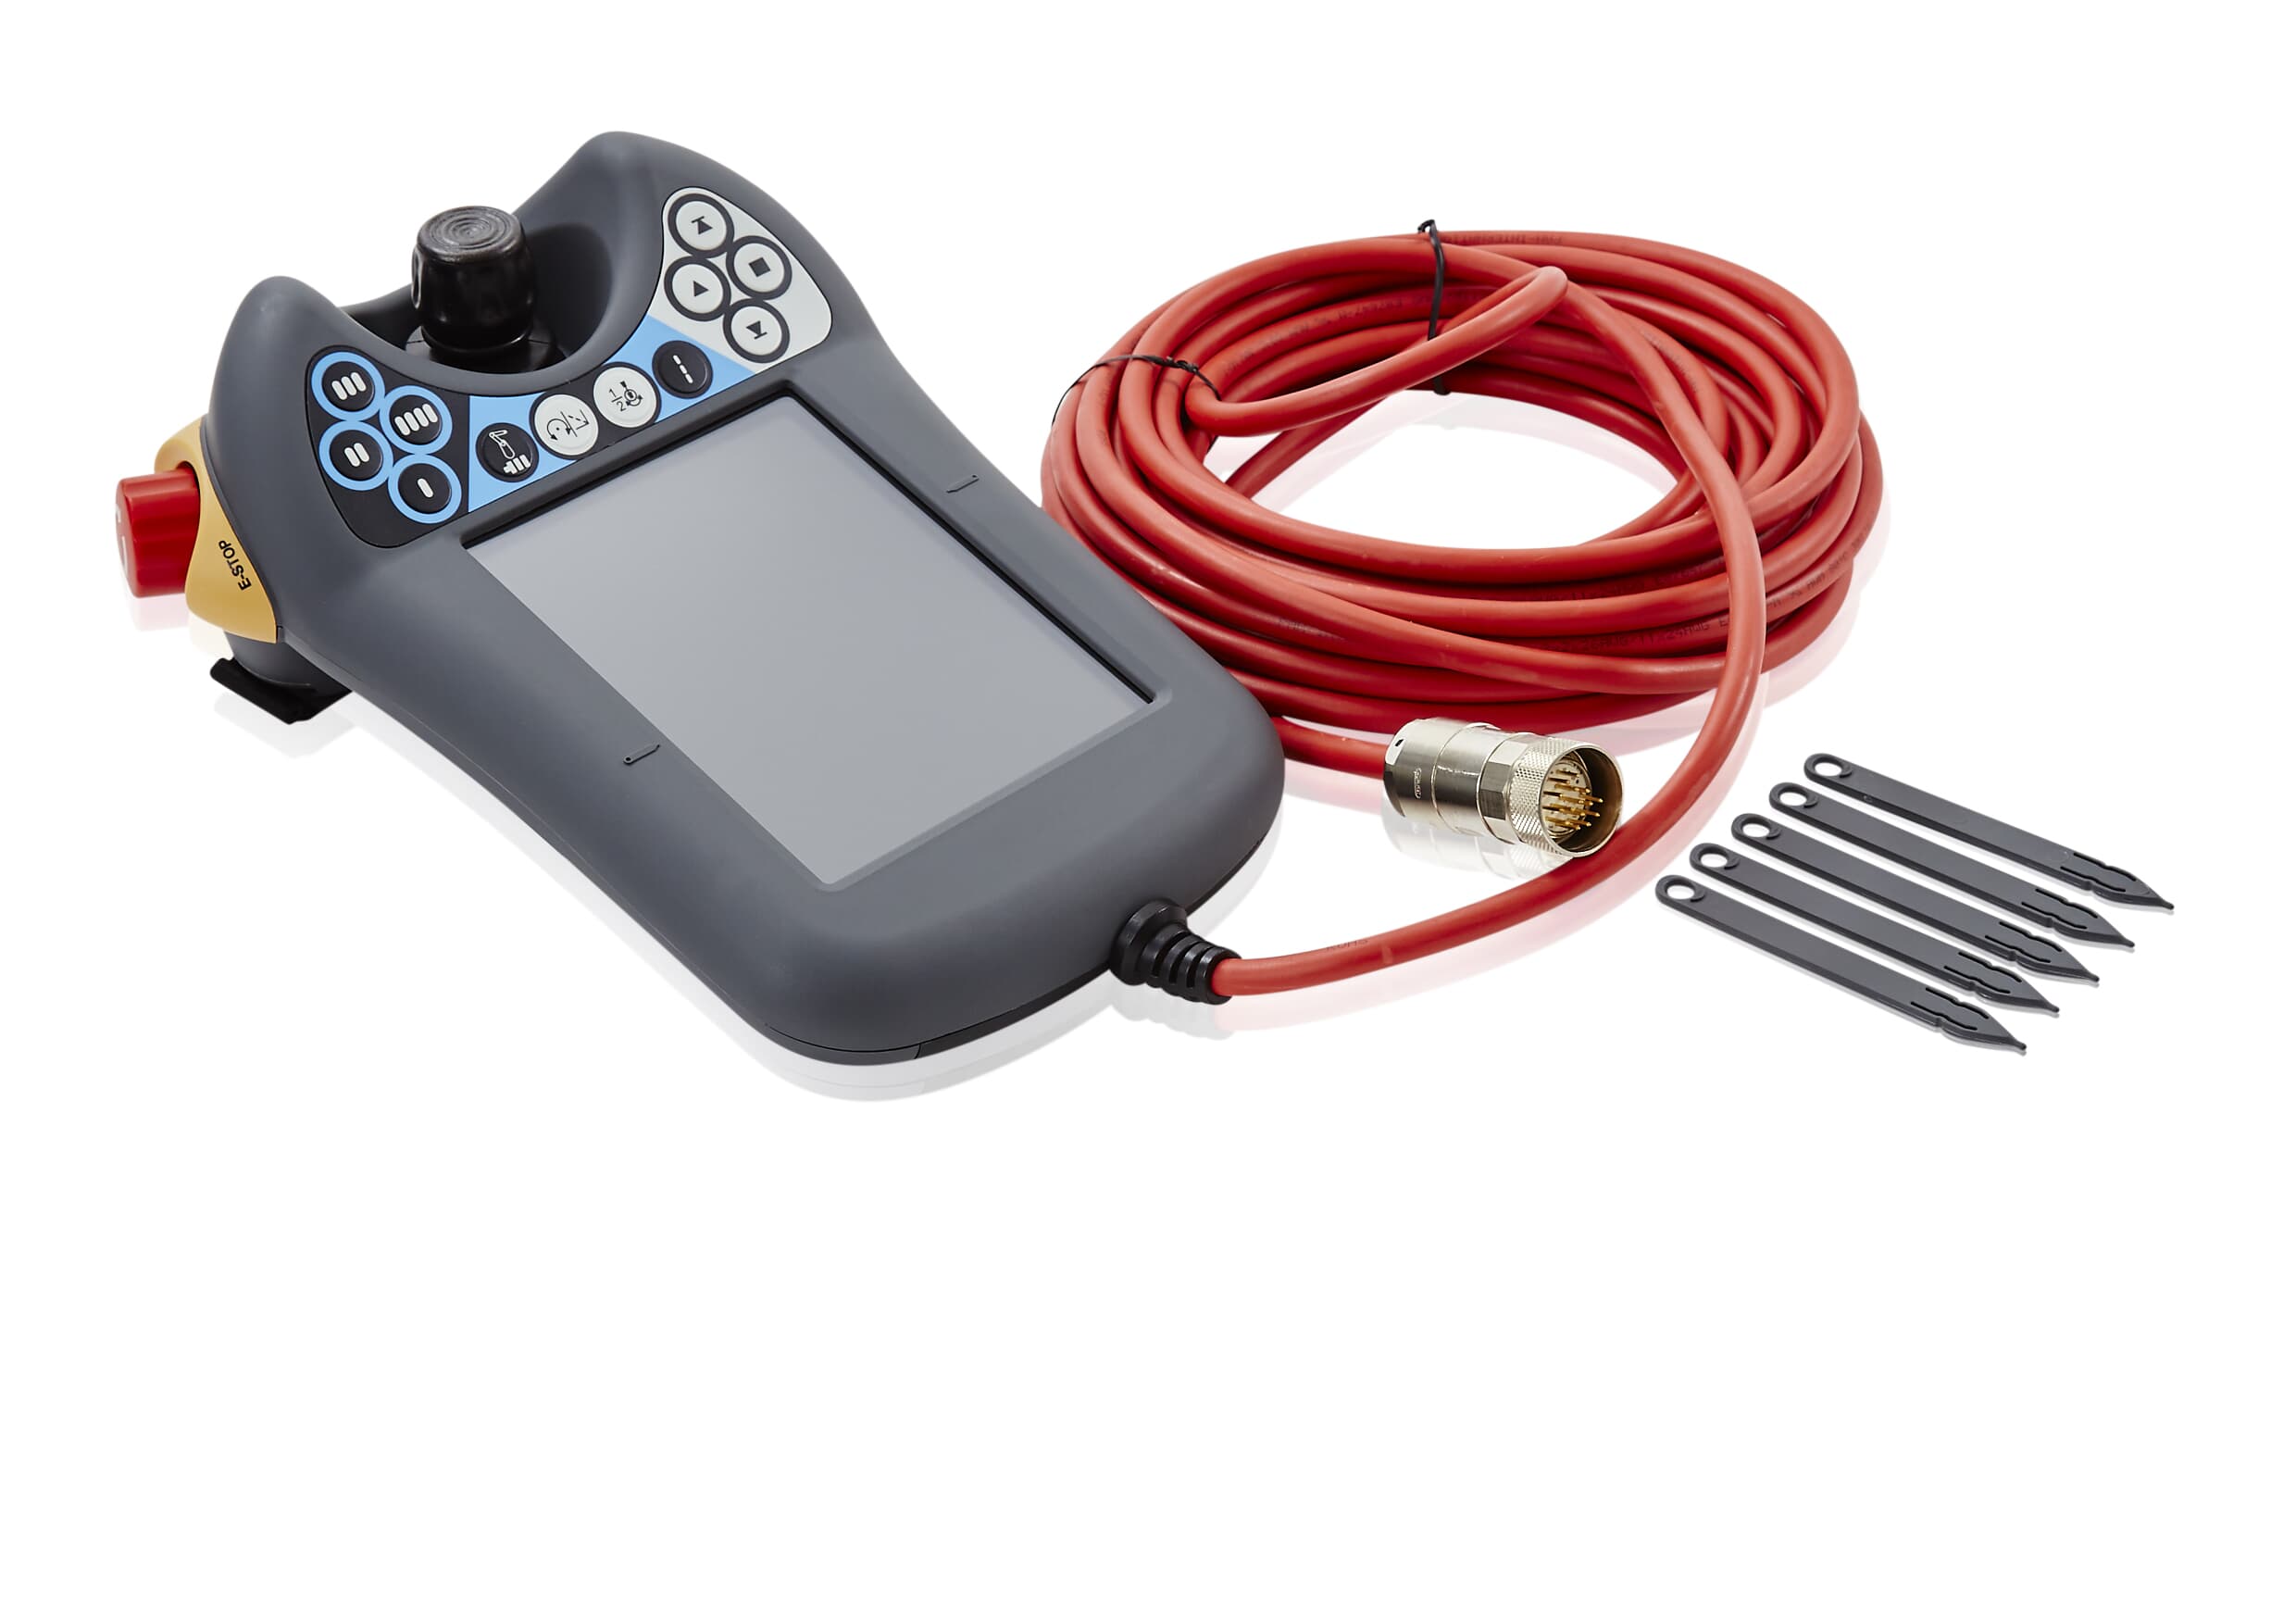
A teach pendant is a handheld control terminal used to program and operate industrial robots. It typically consists of a display screen, buttons, joysticks, and emergency stop functions. Operators use teach pendants to manually guide robots through tasks, define movement paths, set parameters, and store instructions for automated operations. This process is where teach pendant derives its name from.
Key Functions of a Teach Pendant
Teach pendants offer a multitude of functions making it possible for them to complete variety of tasks. Here are some examples of the function of teach pendants.
Teach pendants allow for easy creation and editing of robotic programs. Waypoint and motion sequences can be recorded for repetitive task such as welding and assembly.
Operators can have precise control over equipment movements via joystick or directional buttons.
Teach pendants provide real-time feedback, error messages, and system status updates to quickly diagnose issues.
Emergency stop buttons and dead-man switches ensure safe operation by halting robot movement instantaneously.
Operators can fine-tune speed, torque, and trajectory settings to optimize performance.
Advantages of a Teach Pendant
Teach pendants bring with them a lot of advantages that generally do not come with traditional control systems. For starters, teach pendants are made to be easily user-friendly and intuitive making it easy to train someone on. There’s a level a flexibility that they offer when it comes to programming and changing production settings. An operator can adjust between high and low volume production outputs.
Teach Pendant Types
Wired Teach Pendants – Connected directly to the robot controller, ensuring reliable communication.
Wireless Teach Pendants – Offer greater mobility but may have latency or interference concerns.
Brand-Specific Pendants – Companies like FANUC, ABB, KUKA, and Yaskawa design proprietary pendants tailored to their robots.
Conclusion
Teach pendants remain indispensable in industrial automation, bridging the gap between human operators and robotic systems. As technology advances, these devices will continue to enhance productivity, safety, and adaptability in smart factories worldwide.
By understanding their functionality and benefits, manufacturers can maximize the potential of robotic automation and stay competitive in an increasingly automated industry.
In Need of a Teach Pendant
With a large selection of FANUC, ABB, and KUKA teach pendants, we should have controller that fits your operating needs. Reach out to our team of experts and let us help you optimize your automation experience.
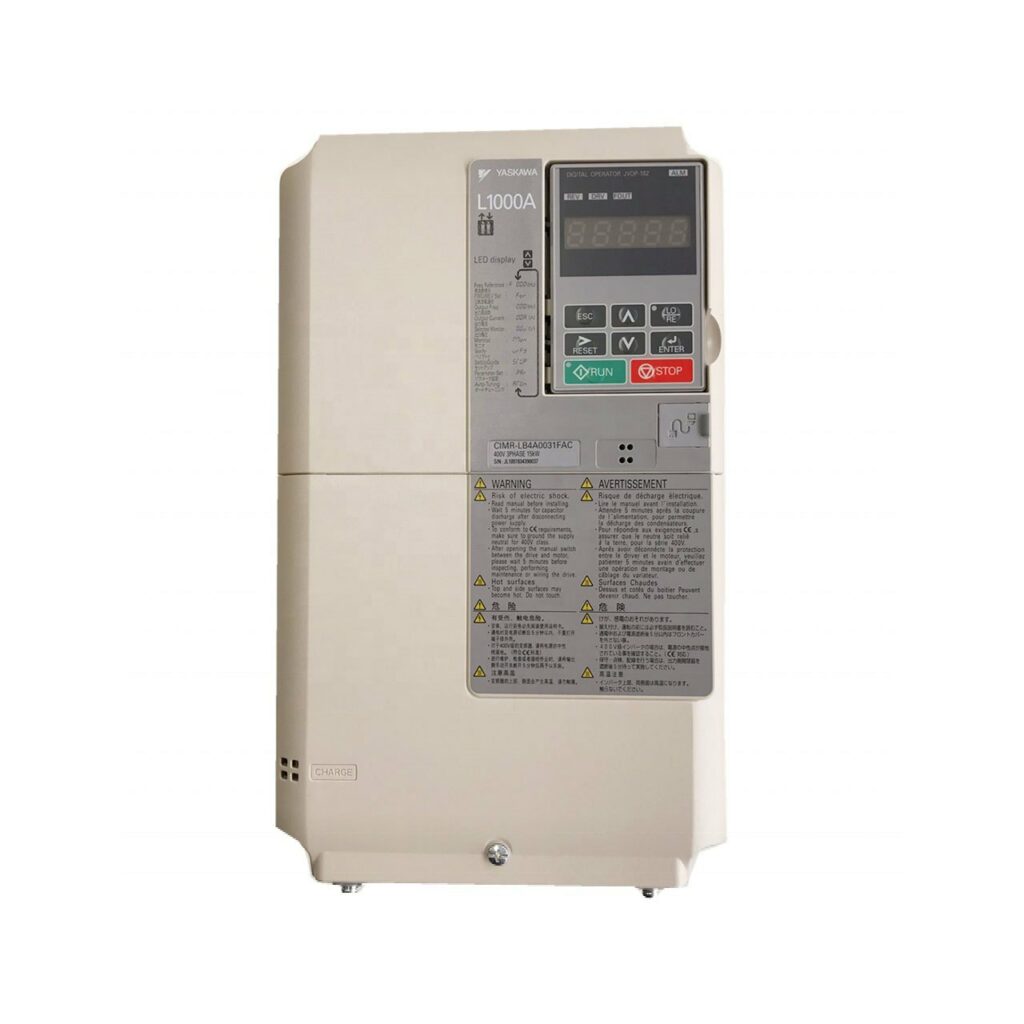
AC drives, also known as variable frequency drives (VFDs) or adjustable speed drives (ASDs), are essential components in modern industrial and commercial applications. They control the speed and torque of AC motors by varying the frequency and voltage of the power supplied to the motor. This capability enhances energy efficiency, reduces mechanical stress, and improves process control.
In this article, we will explore what AC drives are, their key components, how they work, and their benefits in various applications.
In short, an AC drive is an electronic device that regulates the speed and performance of an alternating current (AC) motor. Unlike traditional fixed-speed motors, AC drives allow for precise control over motor speed, acceleration, and deceleration, making them ideal for applications where varying speeds are necessary.
To better understand an AC Drive, we need to think about it in terms of “what makes up an AC Drive” and “How it works”.
The key components of an AC Drive consist of a Rectifier, that converts AC supply to DC voltage. Capacitors that filter and stabilize DC voltage. An inverter that uses pulse-width modulation (PWM) to recreate an AC waveform. Adjustable output controls like a variable switch. This controls AC output and motor speeds.
You can read ore detailed information about AC drives here.
What are the Benefits of AC Drives?
While the upfront cost of installing an AC drive seems high, benefit of long terms savings make investing in an AC drive, a no brainer. Long term savings stands as the biggest benefit of having an AC drive. AC drives manage power consumption of your overall operation making sure your machines are using only the base load requirements. This improved regulation of energy also means less mechanical and electronic stress on your equipment resulting in increased longevity of your machine. The diminished stress also means less maintenance needed which translates to more savings!
Common Applications
AC drives do a lot of behind-the-scenes task that many do not really recognize. However, when you realize how many industries rely on automation, the importance that AC drives have becomes very apparent. Some obvious ones like manufacturing and energy where AC drives get used to run machines like conveyor belts or wind turbines. Some lesser known applications could include water treatment where AC drives an be used to control pumps. AC drives are also used in HVAC systems to control fans, pumps, and compressors for better energy efficiency.
Conclusion
AC drives play a crucial role in modern motor control systems, offering energy efficiency, precise speed regulation, and improved operational performance. By understanding how they work and their benefits, industries can optimize their processes, reduce costs, and enhance equipment longevity.
Whether in manufacturing, HVAC, or renewable energy, AC drives continue to revolutionize motor control, making them indispensable in today’s automated world.
In Need of an AC Drive?
Are you in need of replacing or getting a new AC drive? Let our team of experts help you find a product right for you. Reach out to us and let us help you get your operation up and running!
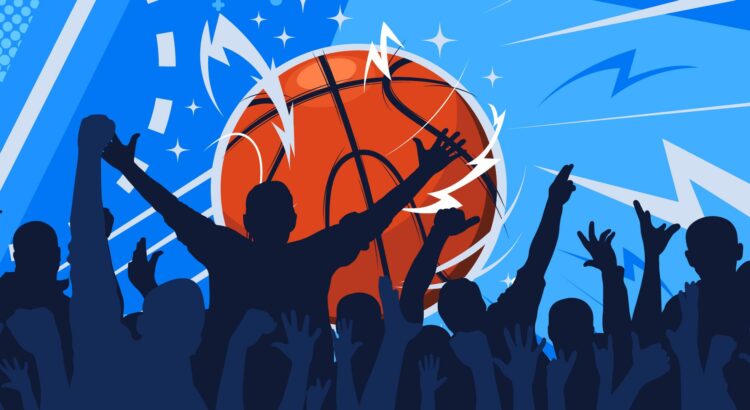
Some sports fans take a loss in stride, while others…not so much. Whether it’s blaming the refs, talking trash even after the final whistle, or full-blown meltdowns, certain states’ sports fans just feel a defeat more deeply. With high-stakes games and bracket-busting upsets fueling emotions this time of year, the intensity is at an all-time high.
To find out which states have the sorest losers, we surveyed over 2,100 sports fans nationwide, asking them about the sportsmanship—and not-so-sportsmanlike reactions—of fans in their state. The results reveal which states take losses way harder than others.
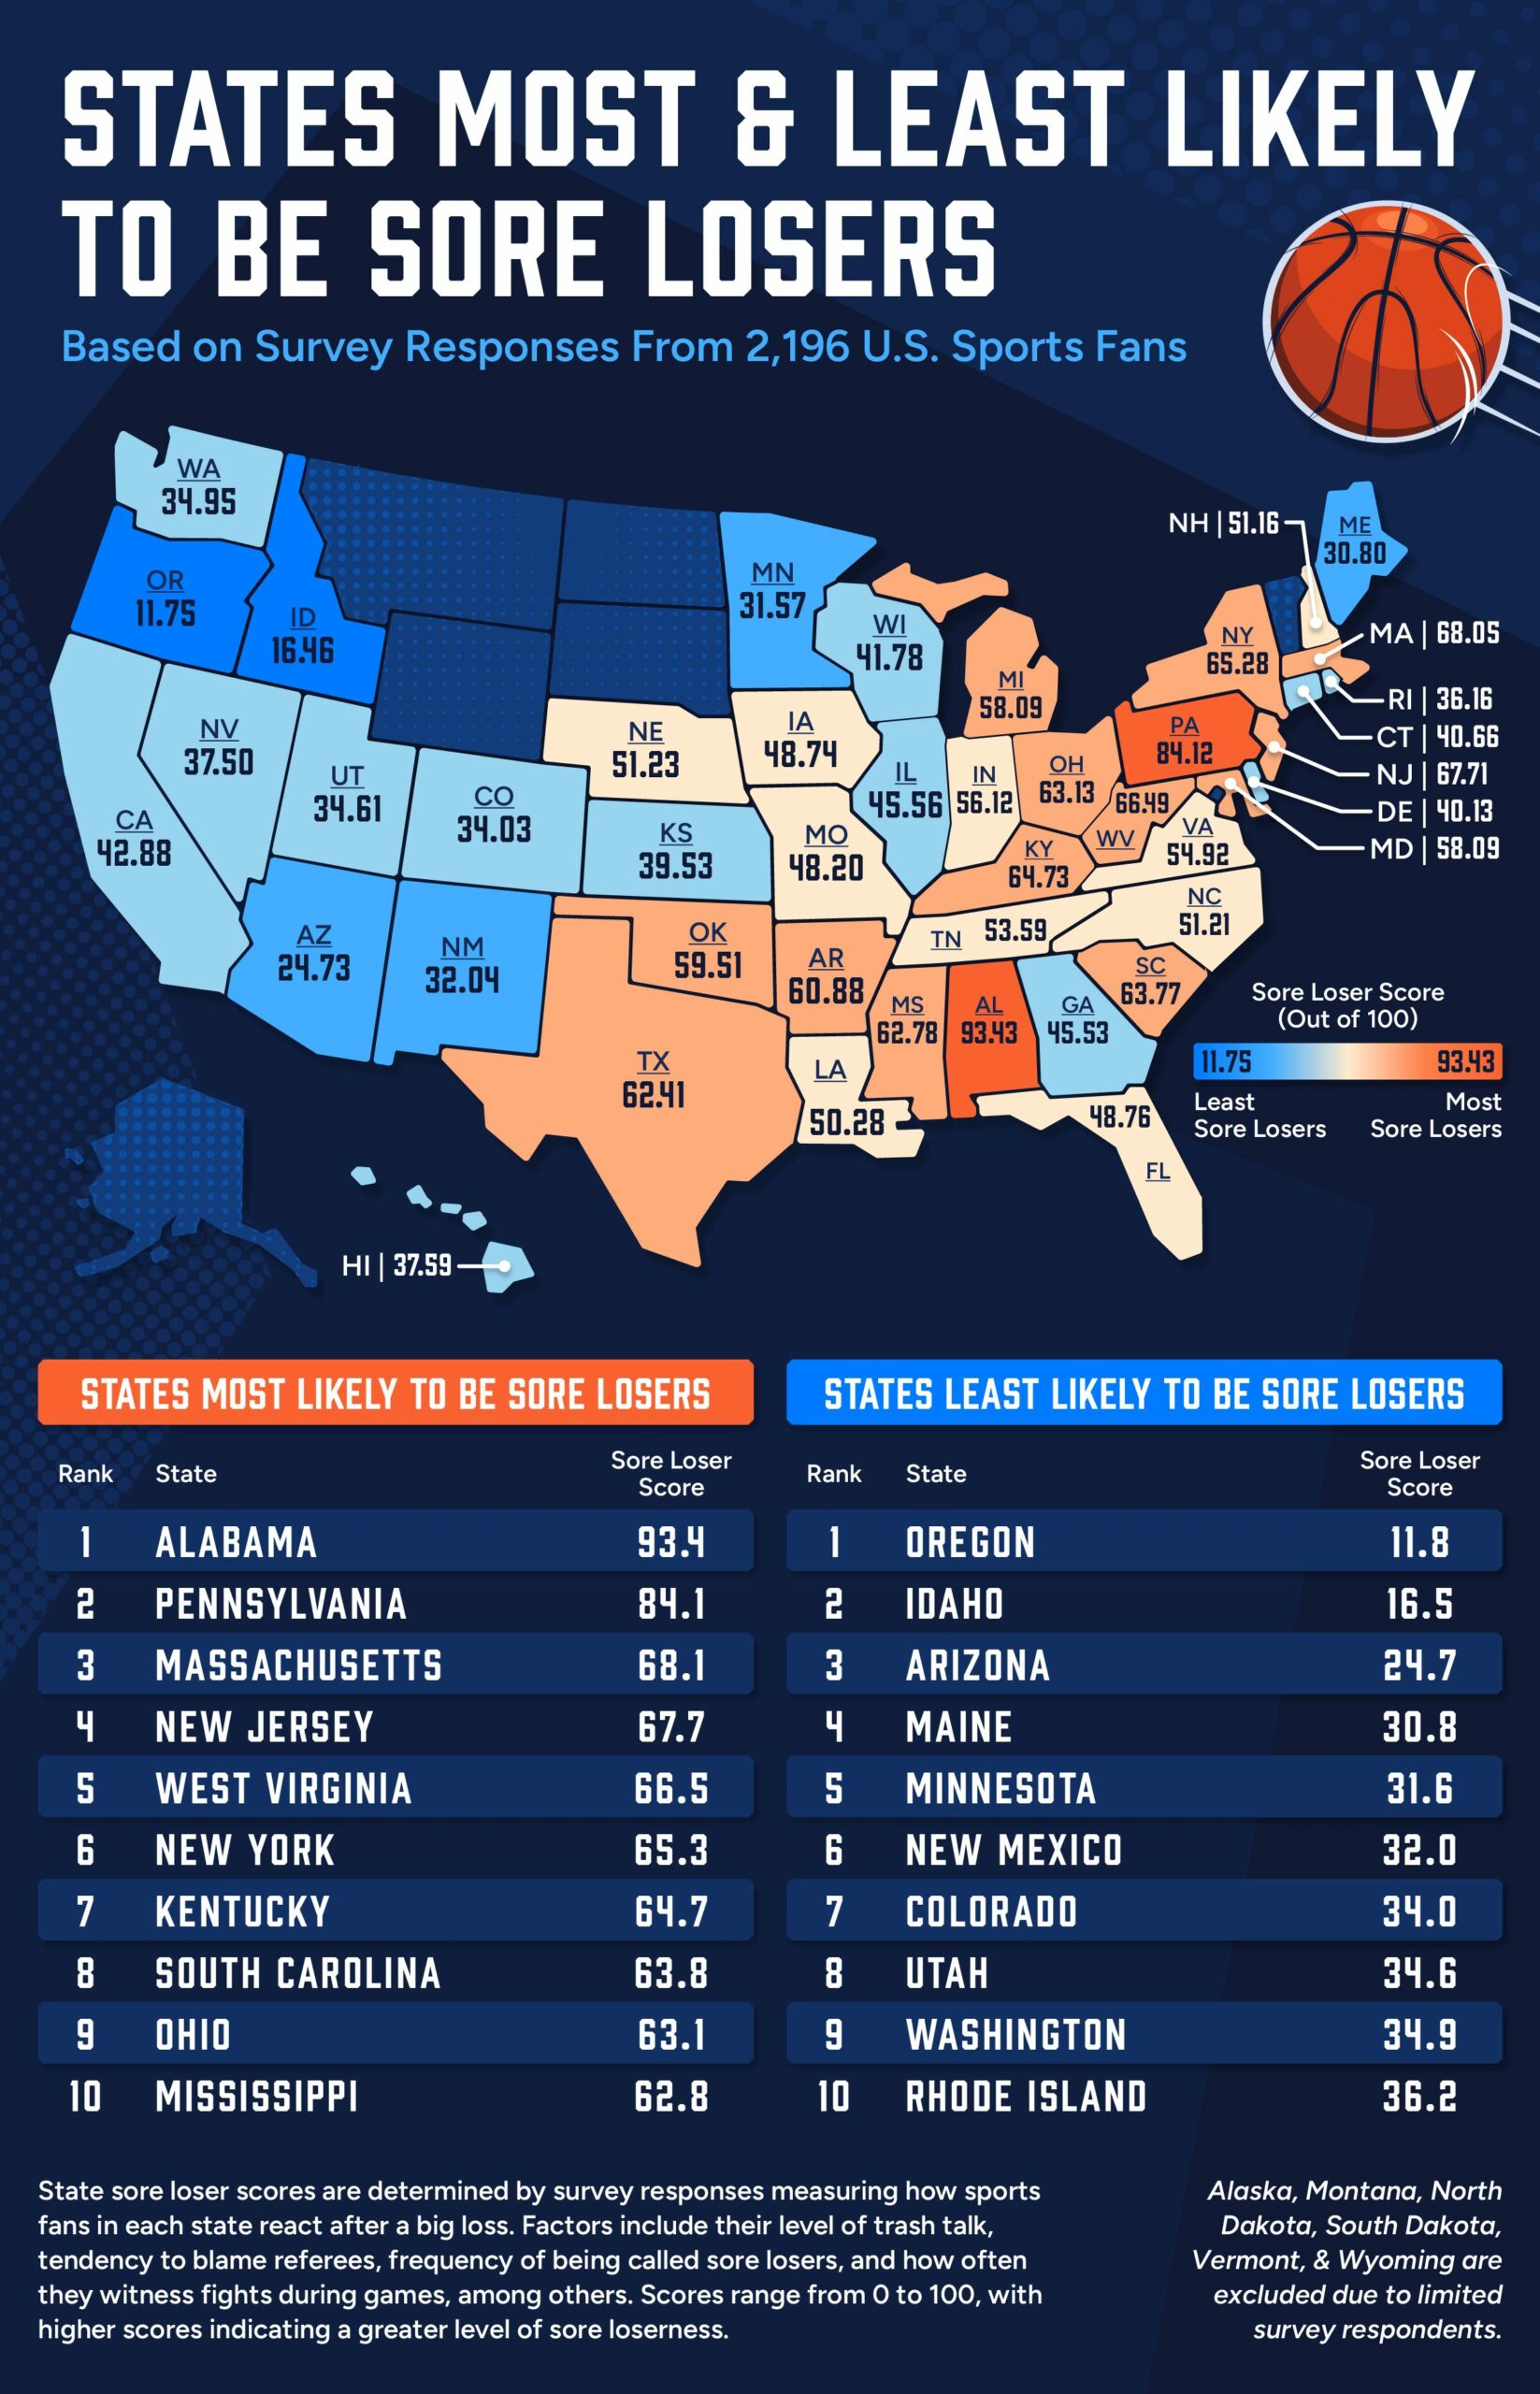
States Most & Least Likely to Be Sore Losers
We surveyed sports fans across 44 U.S. states, asking 10 questions to gauge their level of sportsmanship, competitiveness, and just how hard they take a big loss. The survey measured everything from trash-talking habits to how often fans blame the refs, whether they’ve been called a sore loser, and even how frequently fights break out during games. Each question was answered on a 1-to-5 scale, with 5 indicating a higher likelihood of sore loser behavior. We then averaged the responses and indexed them into a final sore loser score out of 100 for each state—with higher final scores signaling states where taking an “L” hits the hardest.
These are the five states with the sorest losers, and their respective sore loser scores (out of 100):
Alabama – 93.4
Pennsylvania – 84.1
Massachusetts – 68.1
New Jersey – 67.7
West Virginia – 66.5
When it comes to taking a loss very personally, no one does it quite like Alabama.Topping the list with asore loser score of 93.4, Alabama sports fans bring an unmatched level of passion to every matchup. And when the scoreboard doesn’t go their way? Let’s just say they feel it. More than half of Alabamians (51%) admit to having a total meltdown after a big loss—the only state in the survey where this was the most common reaction. And if you’ve ever heard “the refs blew it!” echoing through an Alabama bar or living room, that checks out too: 33% say they “almost always” blame losses on bad calls, while 41% say they do it “often.” What’s more, 43% of Alabama respondents say they’ve witnessed a sports fan throw a tantrum after a loss more times than they can count.
That intensity isn’t just reserved for college rivalries—it starts early. Alabama parents bring just as much energy to the sidelines of youth sports. A quarter of Alabama respondents (25%) say parents in their state “almost always” get too worked up at kids’ sporting events, while 37% admit they do so “often.” Whether it’s a Saturday in Bryant-Denny or a little league game in Birmingham, one thing is clear: Alabama takes its sports very seriously.
Trailing behind but still bringing the drama are Pennsylvania, Massachusetts, New Jersey, and West Virginia—all states where sports are treated with near-religious devotion. When asked, “Which best describes your state’s sports fanbase?” Pennsylvania respondents were the most likely to choose “We talk trash before and after the game, win or lose”—a sentiment shared by nearly 60% of them. And that competitive spirit doesn’t always go unnoticed. Half of Pennsylvania respondents admit they’ve been called a sore loser at least once or twice, while in neighboring New Jersey, 45% of respondents say the same.
Over in Massachusetts, nearly half of respondents say sports are taken “extremely seriously—every game feels like a big deal.” But if you’re looking for high-intensity matchups, West Virginia might take the crown. More than half (54%) of respondents in the state have witnessed a fight break out during a game they were playing in. And the passion starts early—15% of West Virginia respondents say parents in their state “almost always” get too worked up at kids’ sporting events, while 38% say it happens “often.”
On the opposite end of the spectrum, these are the five states least likely to be sore losers, and their respective sore loser scores (out of 100):
Oregon – 11.8
Idaho – 16.5
Arizona – 24.7
Maine – 30.8
Minnesota – 31.6
Some states accept losses with a bit more grace than others. According to survey results, Oregon is the least likely state to be full of sore losers, with a sore loser score of just 11.8. And the numbers back it up: 56% of Oregonians have never been called a sore loser, and when their team takes a big loss, 67% say they’re unbothered or don’t care at all, simply shrugging it off with an “it’s just a game” mentality. Even trash talk is kept to a minimum—a third (33%) rarely or never talk smack after a loss. And if you’re looking for sports parents who keep their cool, Oregon is the place to be. Not a single respondent said parents in their state “almost always” get too worked up at kids’ sporting events, and only 13% said it happens “often.”
Arizona and Idaho also rank among the least sore loser-prone states, with nearly half of respondents (48% in AZ, 47% in ID) saying they’ve never been called a sore loser. Idaho, in particular, leads the nation in sportsmanship—32% say they’ve never seen a fan throw a tantrum after a loss, the highest percentage of any state. Meanwhile, over in Maine, 64% of respondents say sports fans there don’t dwell on losses, and in Minnesota, 63% describe their fanbase as “passionate but mostly respectful.” Minnesotans also keep their cool in the heat of the game—67% say fights during games almost never break out, while another 20% say it’s rare.
Full State-by-State Ranking
Curious about where your state ranks? Our interactive table below breaks down the full survey results, showing the most common answers for all 10 sore loser-focused questions in each state. You can search for your state or sort by different categories to see which fanbases take losses the hardest—and which ones truly let it go.
Closing Thoughts
At the end of the day, some states take sports losses harder than others—and our survey proves it. Alabama, Pennsylvania, and Massachusetts top the list as the sorest losers, where fans are more likely to blame the refs, talk trash after a loss, and even witness full-blown meltdowns. Meanwhile, Oregon, Idaho, and Arizona keep things cool, proving that not every fanbase lets a tough defeat ruin their day. Whether your state lives for the thrill of competition or takes an “it’s just a game” approach, one thing is clear: sports bring out strong emotions, win or lose.
Just like sports fans rely on their teams to show up and perform, businesses rely on industrial automation systems to keep things running smoothly—because downtime is never an option. At MRO Electric, we specialize in repairing and supplying industrial automation components, helping businesses maintain peak performance even under pressure. Get in touch with us today to keep your operations running at championship level.
Methodology
To find the states with the sorest losers, we conducted a survey of 2,196 U.S. sports fans across 44 states. The survey ran over a one-week period, from February 12 to February 19, 2025. Alaska, Montana, North Dakota, South Dakota, Vermont, and Wyoming were excluded from the survey due to limited survey respondents in those states.
For the state ranking portion of our study, we evaluated states across 10 key survey questions that reflect sore loser behaviors, ultimately measuring how sports fans in each state react after a big loss. Questions included their level of trash talk, tendency to blame referees, frequency of being called sore losers, and how often they witness fights during games, among others. Each question was answered on a 1-to-5 scale, with 5 indicating a higher likelihood of sore loser behavior. We then averaged the responses and indexed them into a final sore loser score out of 100 for each state—with higher final scores signaling states most likely to be sore losers.
From trading cards to Nintendo Switch battles, Pokémon has been a staple in pop culture for nearly three decades. But which pocket monster captures the most hearts across the U.S.? We analyzed Google Trends search data over the past 20+ years to uncover the most searched Pokémon in every state. Whether you’re team Pikachu or partial to a more mysterious pick, this map of America’s favorite Pokémon reveals where fan loyalties lie.
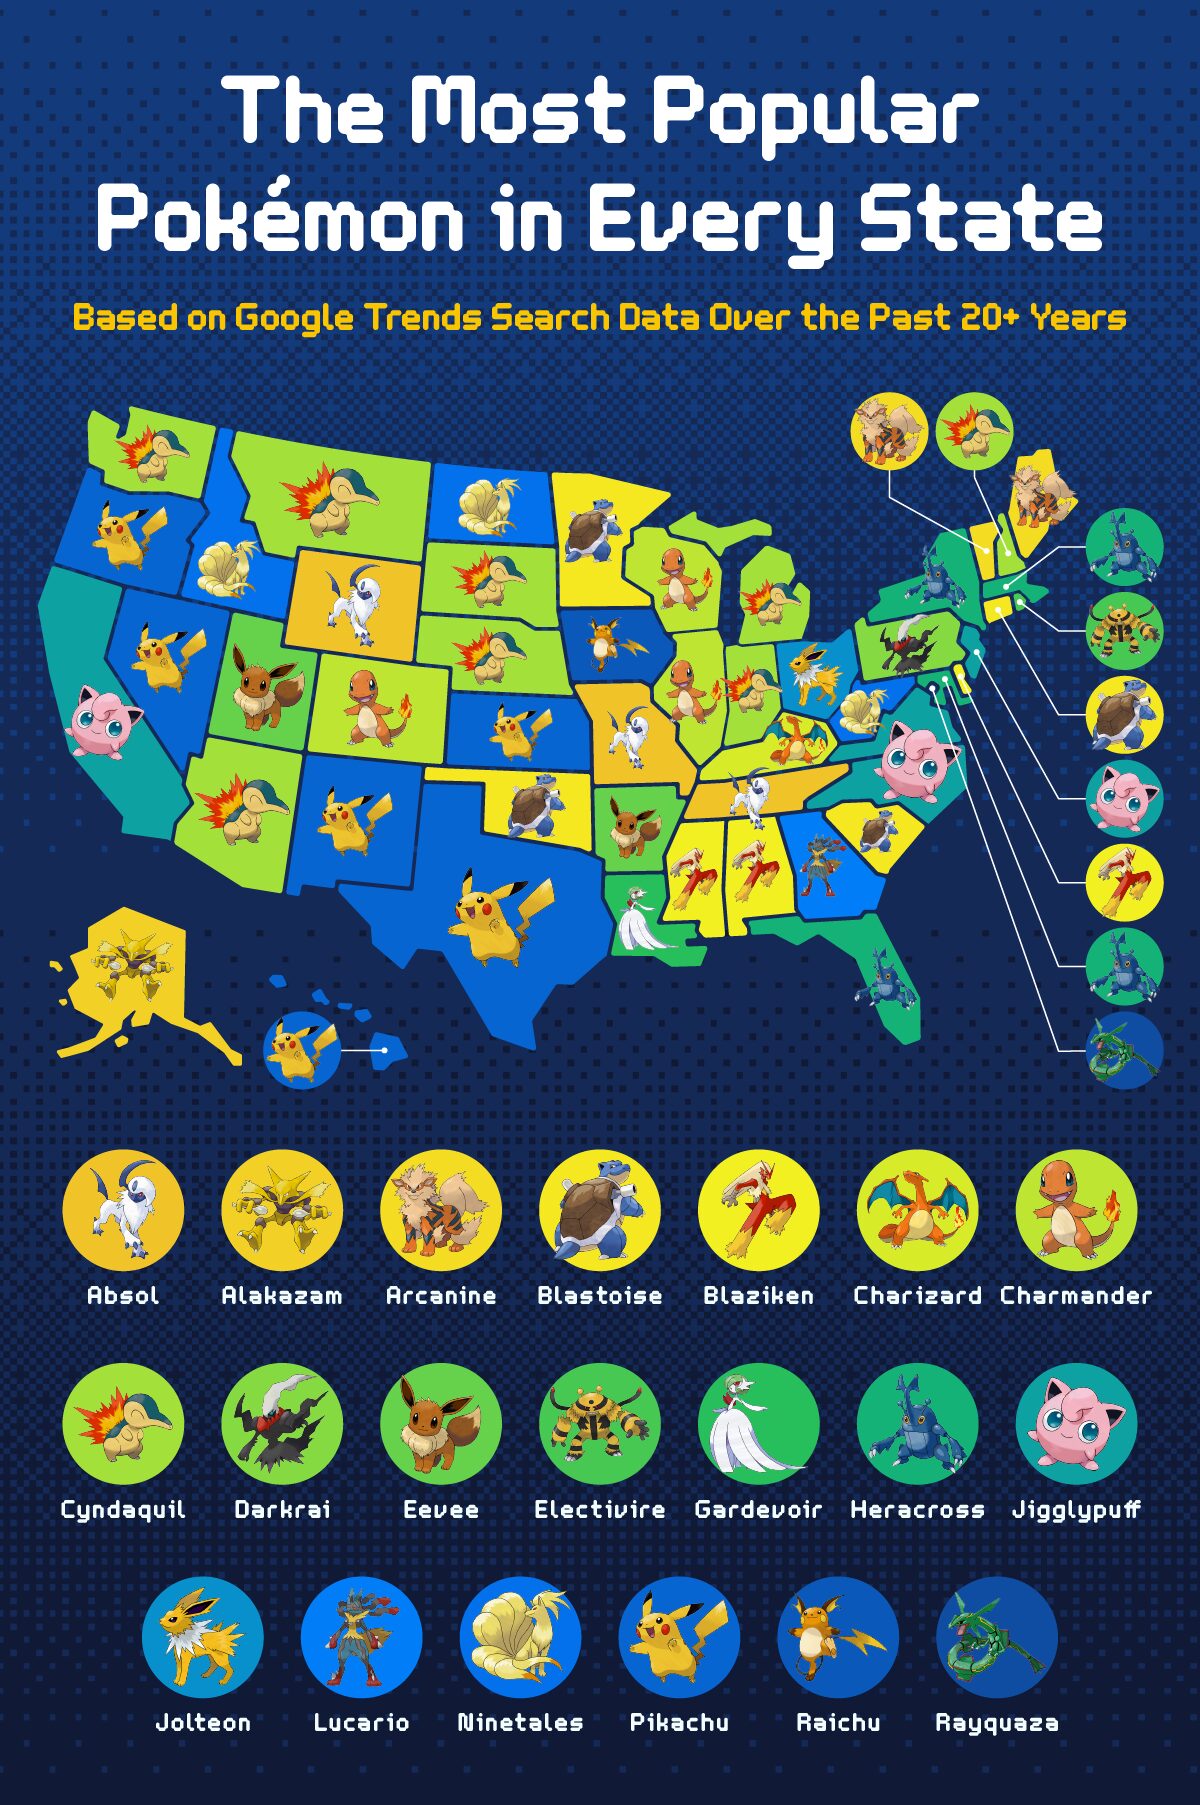
The Most Popular Pokémon in Every State
From electrifying classics to underrated evolutions, each U.S. state has its own Pokémon preference—and the trends are more surprising than you’d think. By analyzing Google Trends search interest, Cyndaquil emerged as a national favorite, capturing the top spot in eight states, including Arizona, Indiana, Michigan, and Washington. Its consistent appearance in both the Midwest and the Mountain West points to a regional fondness for this fiery Johto starter.
Pikachu, arguably the franchise’s most iconic figure, claimed dominance in six states, such as Hawaii, Texas, and Oregon, proving its enduring appeal from coast to coast. Notably, states like Nevada and New Mexico also showed strong interest in the beloved electric mouse, reinforcing Pikachu’s universal charm.
Other nostalgic favorites, such as Blastoise and Jigglypuff, also had strong showings. Blastoise was the top searched in Connecticut, Minnesota, Oklahoma, and South Carolina, while Jigglypuff’s melodic mischief resonated in California, New Jersey, North Carolina, and Virginia. Meanwhile, Ninetales—known for its mystical aura—stood out as the favorite in Idaho, North Dakota, and West Virginia, highlighting a possible coastal-to-heartland appreciation for more elegant, fox-like Pokémon.
Unique picks also dotted the map: Washington D.C. went with the legendary Rayquaza, Ohio preferred Jolteon, and Rhode Island singled out Electivire. Even lesser-hyped names like Absol and Arcanine saw multiple state wins, with Absol topping the lists in Missouri, Tennessee, and Wyoming, and Arcanine being favored in Maine and Vermont.
Which Pokémon Shines Above The Rest?
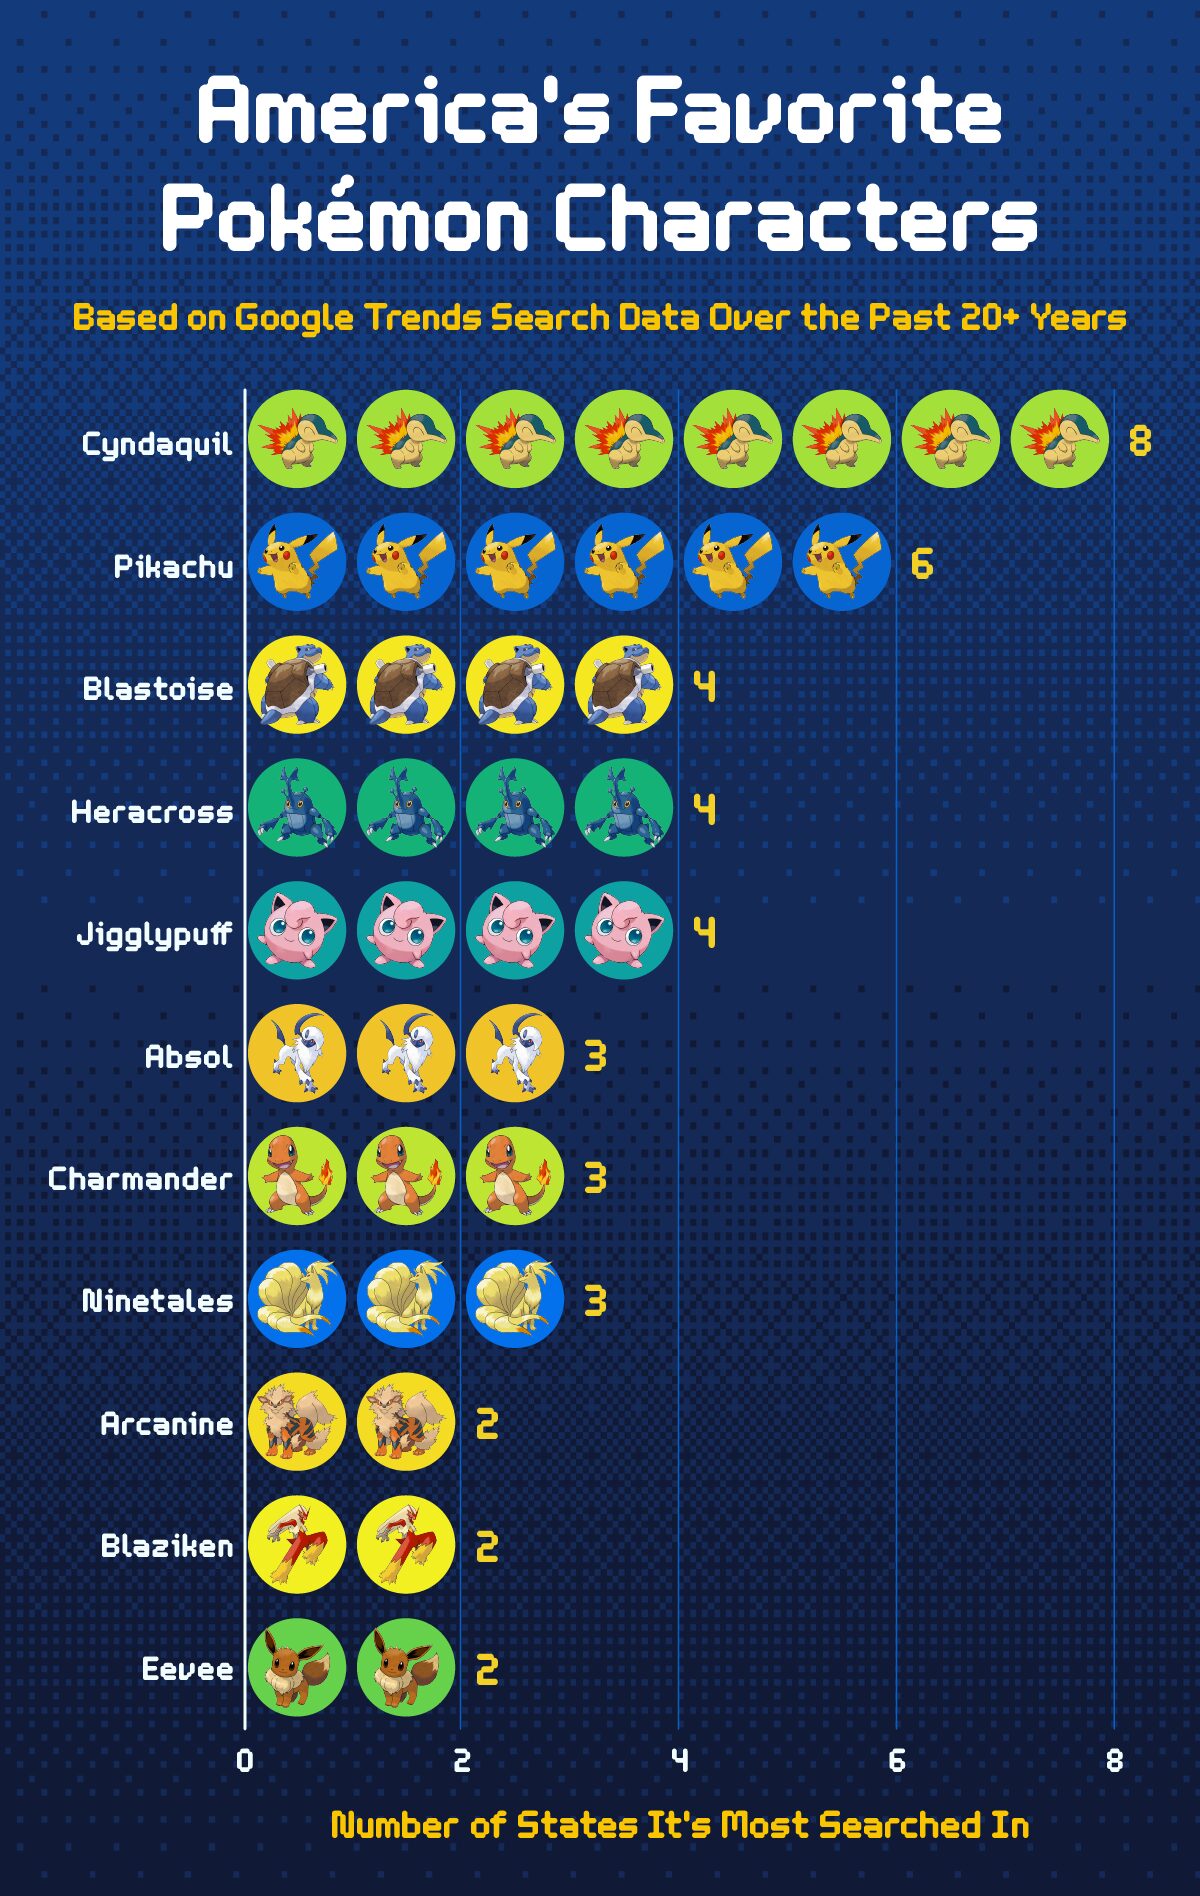
Zooming out from the state-by-state breakdown reveals a clear top-tier favorite: Cyndaquil. This Fire-type starter from the Johto region claimed the number one spot in eight states, far outpacing other Pokémon in our search analysis. Its widespread appeal may stem from a combination of nostalgia—many Millennials and Gen Z players first encountered Cyndaquil in the Pokémon Gold and Silver era—and a fondness for its unassuming design that evolves into the formidable Typhlosion. It’s official, Cyndaquil, America chooses you!
Close behind is Pikachu, leading in six states and proving that being the mascot of a multi-billion-dollar franchise still carries weight. Pikachu’s presence across various forms of media—from video games and anime to merchandise and movies—makes it one of the most recognizable and beloved characters in the world, and its popularity across both primarily urban and primarily rural states suggests universal appeal.
Blastoise, Heracross, and Jigglypuff each dominated in four states. Blastoise, a powerhouse final evolution, likely resonates with fans who value strength and reliability. Heracross, on the other hand, might surprise some, but its appearance in several Johto episodes and its unique Bug-Fighting type combination could explain its niche yet consistent fan base. Meanwhile, Jigglypuff’s cutesy appeal and long-standing role in the Super Smash Bros. series likely contribute to its steady popularity.
Pokémon like Absol, Charmander, and Ninetales each took three states. Absol’s enigmatic design and association with disaster may intrigue fans looking for something darker. Charmander, another starter Pokémon, holds a special place in the hearts of longtime fans. And Ninetales, with its elegant design and lore-inspired background, appeals to those who enjoy the mystical and majestic side of the Pokémon universe.
While many expected heavyweights like Charizard and Lucario to rank higher, they only topped the charts in one state each, possibly due to their saturated presence in franchise marketing, making them feel less novel to today’s fans.
Which Pokémon Generation Is Favored by the Most States?
Generation I: 11 Pokémon
Generation III: 4 Pokémon
Generation IV: 3 Pokémon
Generation II: 2 Pokémon
When it comes to Pokémon popularity, the classics still reign supreme. Generation I—the original 151—dominates the list with 11 of the most searched Pokémon across U.S. states. From household names like Pikachu, Charizard, and Blastoise to fan-favorites like Arcanine and Jigglypuff, these Pokémon continue to resonate with fans decades after their debut. This trend likely reflects the lasting impact of the franchise’s early success and the nostalgia associated with its first wave of games and anime episodes.
Meanwhile, Generation III and IV Pokémon hold their own, contributing four and three top-ranked Pokémon, respectively. Pokémon like Blaziken, Gardevoir, Rayquaza, and Lucario gained traction through their roles in key game titles and continued prominence in competitive battling. Their presence on the list signals a strong showing from the early 2000s generation of players who grew up during the Game Boy Advance and Nintendo DS eras.
Generation II, surprisingly, is represented by only two Pokémon—Cyndaquil and Heracross—despite being home to many beloved characters. While Cyndaquil’s wide appeal helped it become the most favored Pokémon in the nation, the overall underrepresentation of Generation II may suggest that, although it’s loved, it hasn’t maintained the same broad cultural imprint as Generations I and III.
Closing Thoughts
Whether it’s Cyndaquil’s underdog charm, Pikachu’s evergreen popularity, or the unexpected rise of Heracross, each state has its own favorite—and its reasons for that loyalty.
Just like Pokémon fans have their go-to favorites, manufacturers and engineers rely on trusted solutions to keep their operations running smoothly. At MRO Electric, we specialize in repairing and supplying top-tier industrial automation components, including those from brands such as Schneider Electric, Control Techniques, Modicon, and others. Whether you’re tackling unexpected downtime or planning for long-term system upgrades, contact us today to ensure your operations stay strong, reliable, and battle-ready.
Methodology
To determine the most popular Pokémon in every U.S. state, we compiled a list of fan-favorite characters sourced from Guidestrats, Game Informer, and Comic Vine. We then analyzed Google Trends data from 2004 to the present, measuring search interest for each Pokémon across all 50 states and the District of Columbia. The Pokémon with the highest relative search interest in each state was identified as that state’s favorite. High search volume was used as an indicator of popularity, reflecting public curiosity and fan engagement at the state level.