This holiday season, it isn’t Santa who does all the work behind the scenes— it’s your city’s delivery drivers! Delivery drivers are the vital link between online clicks and the gratifying thump of a package arriving on the doorstep. Whether it’s that last-minute gift for the in-laws or more holiday decor, they’re the unsung heroes who make it happen. Yet, the delivery driving experience can differ dramatically from one city to the next.
We put 100 U.S. cities under the microscope, examining factors like hourly wages, road conditions, availability of public restrooms, and more to discern where your presents will be delivered with ease and where drivers will struggle most to play Mr. Claus. Curious about where your city stands? Buckle up, and let’s hit the road!
The 10 Best & Worst Cities for Delivery Drivers
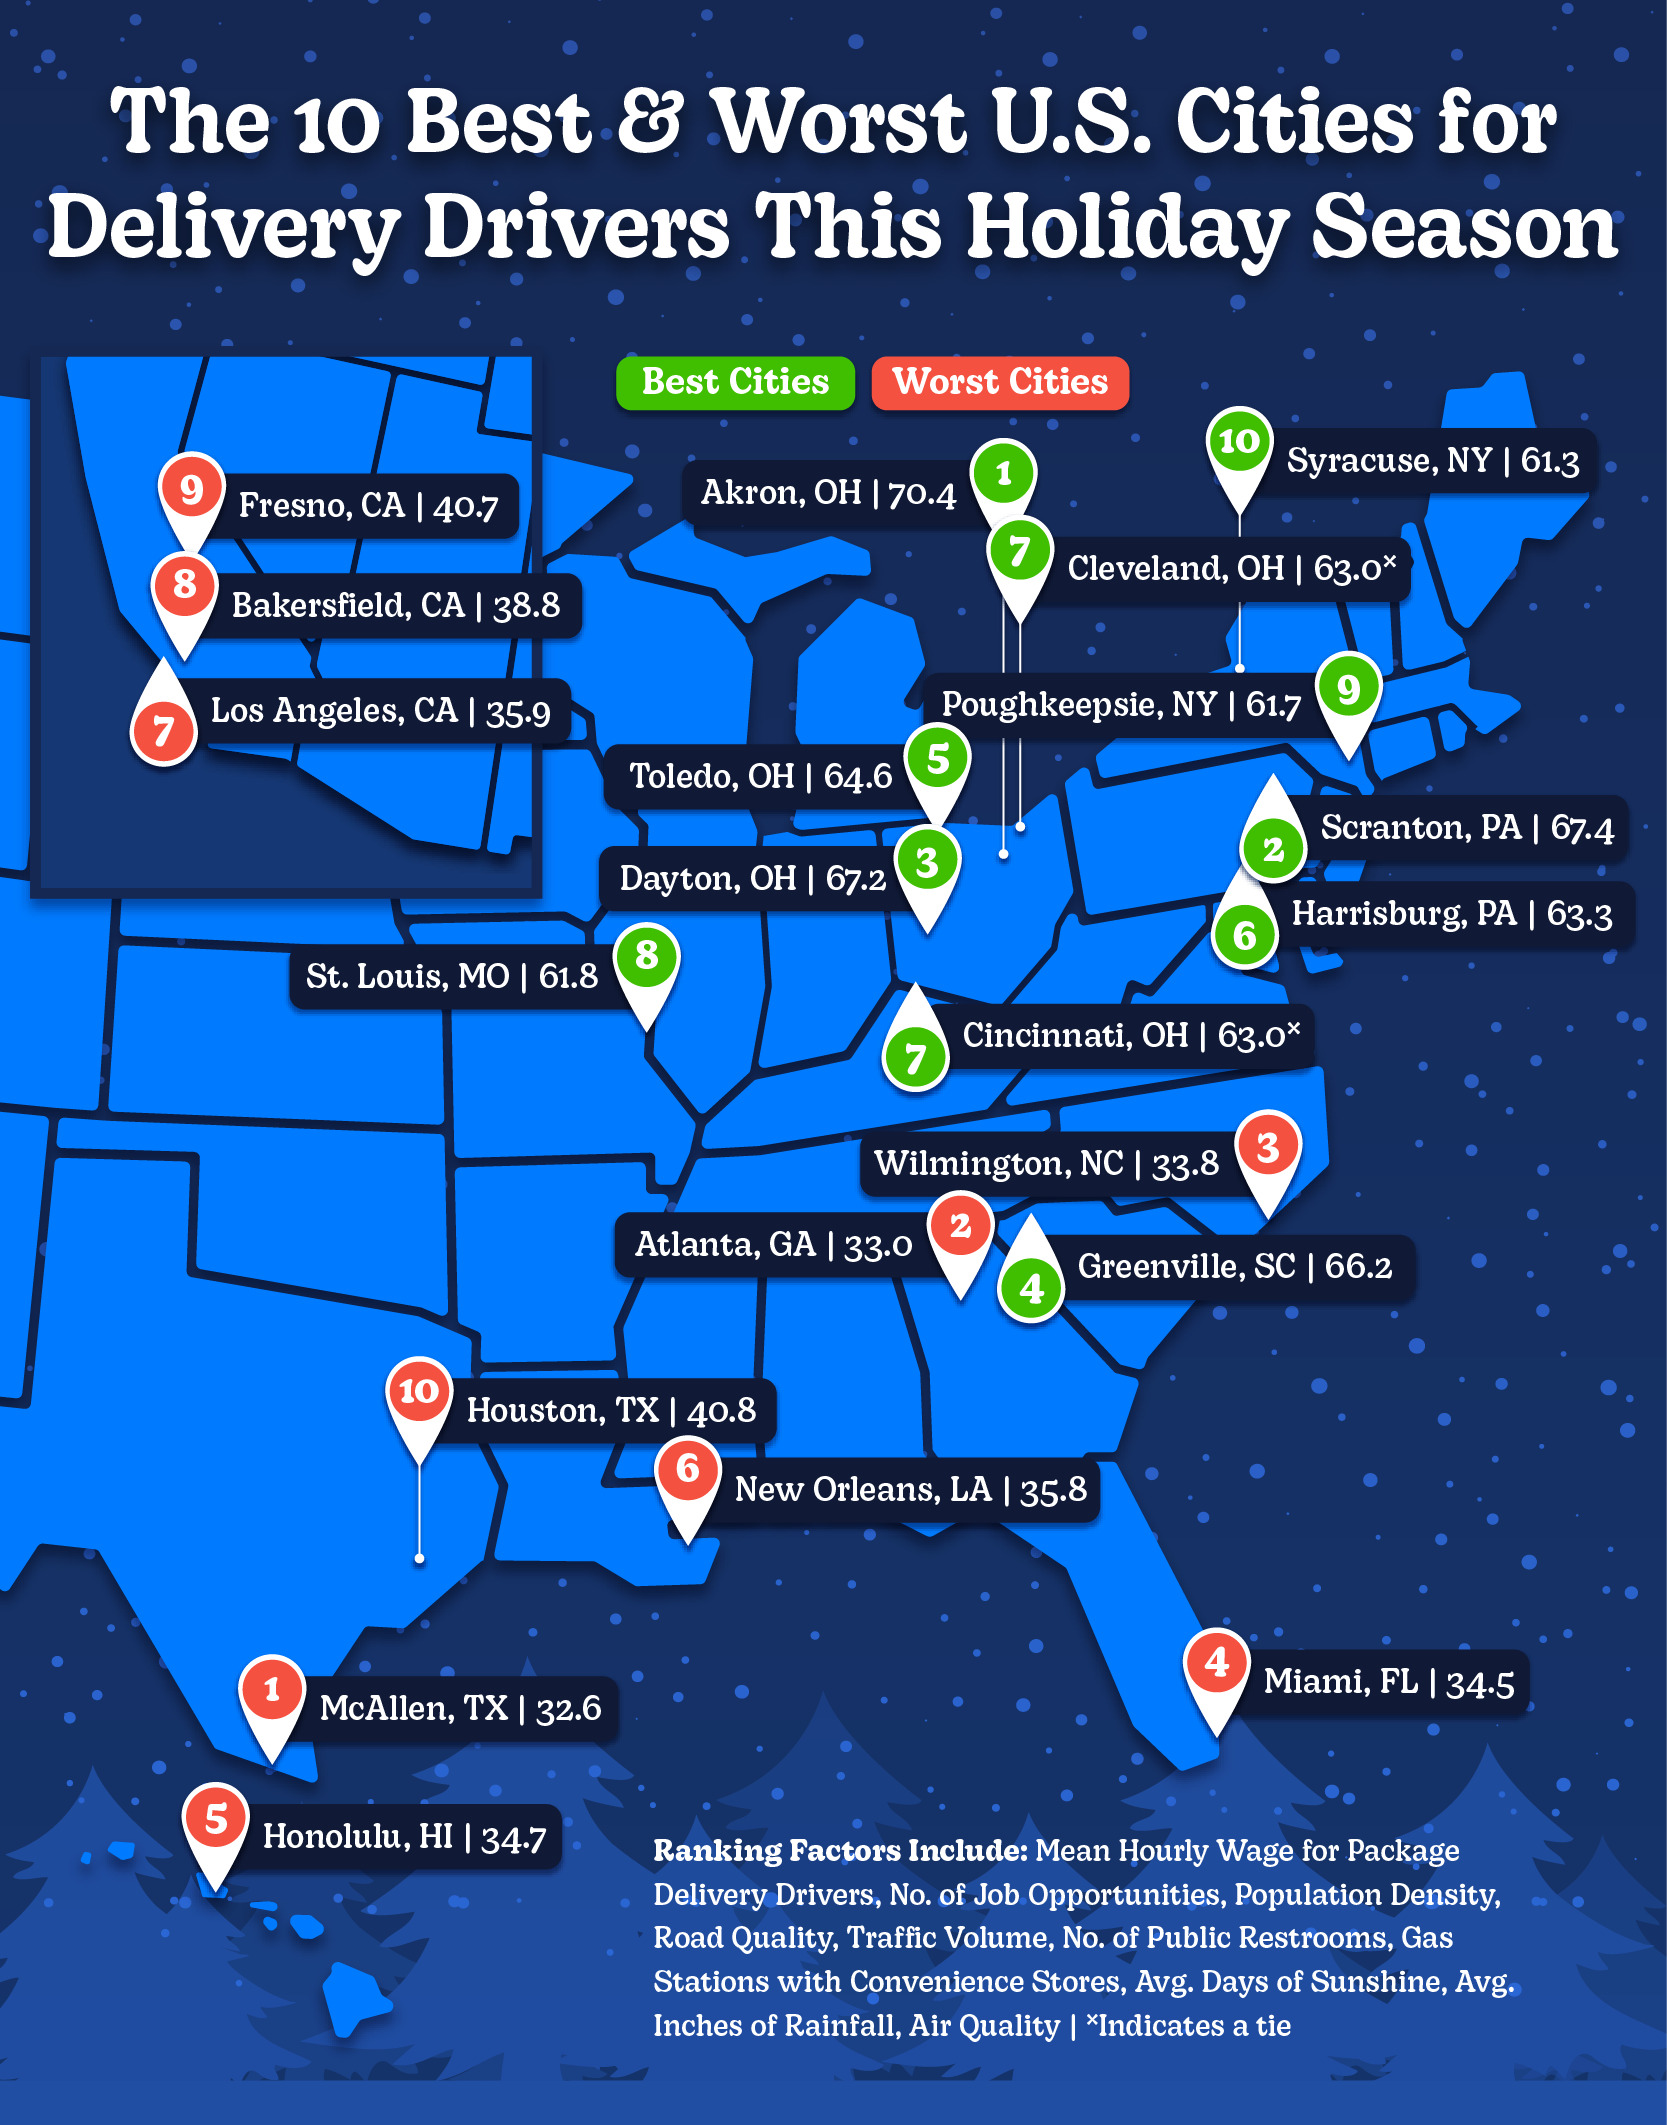
The results are in, and Akron, Ohio sets the bar as the top U.S. city for delivery driving with several keys to a driver’s heart, including plenty of job opportunities and traffic-free routes!
Bonus: The midwestern city also has the second most public restrooms per 100K residents for delivery drivers across all cities in our study.
On the flip side, McAllen, Texas, presents more challenging scenarios. The city’s road quality is low and there’s very few gas stations with convenience stores per capita, making it the most difficult city for delivery drivers, according to the data.
The Best Cities for Delivery Drivers by Category
Looking for delivery driver opportunities? Harrisburg, Pennsylvania, is a beacon of opportunity. The bustling capital city boasts over 2,800 job listings for delivery drivers, the most per capita of any city we analyzed.
Meanwhile, the Golden State of California dominates the Salary category, with San Jose and San Francisco sweeping the #1 and #2 spots. Package delivery drivers in these cities make the most per hour than any other city analyzed at $24.93 and $24.78 per hour, respectively.
Imagine driving where the sun always shines, the roads are open, and the weather is your ally, not your adversary. When it comes to performance factors that make a day behind the wheel feel more like a Sunday drive, Colorado Springs, Colorado is the clear winner. With lower traffic volume, excellent air quality, and ample available refreshments, Colorado Springs is a true delivery driver’s paradise.
Closing Thoughts
While our study reveals some stark differences in the day-to-day experiences of delivery drivers from city to city, it’s a demanding job requiring stamina, patience, and a level head, no matter where you drive.
At MRO Electric, we salute the tireless men and women who take to the streets of America, delivering our packages safely and on time. Without you, we couldn’t offer same-day shipping and the optional overnight shipping on our factory new surplus and remanufactured products.
MRO can find and deliver the part you need, fast– contact us today!
Full Data
Not seeing your city above? No worries, you can still see how it stacks up! We compiled our full data study for all 100 U.S. cities into an interactive data table below. Search for the city you call home or click on the heading of each column to sort by that category.
Methodology
To find the best cities for delivery drivers, we started with a list of the 100 most populated cities in the U.S. and ranked them from 1 to 100 based on factors that would be important to delivery drivers. Next, we divided those factors into three categories: salary, job opportunity, and performance-affecting factors. We then assigned weights to each factor depending on its importance to a delivery driver. Finally, based on those weights, we gave each city we analyzed a score out of 100. See the table below for a detailed list of the factors we used and which category they fell under.
| Ranking Factor | Ranking Factor Category | Weight | Source |
| Mean Hourly Wage for Service Delivery Drivers | Salary Factor | 2.50 | BLS |
| No. of Job Opportunities | Job Opportunity Factor | 3.00 | Indeed |
| Population Density | Job Opportunity Factor | 3.00 | Census |
| Road Quality | Performance Affecting Factor | 2.50 | CoPilot |
| Traffic Volume | Performance Affecting Factor | 3.00 | County Health Rankings |
| No. of Public Restrooms | Performance Affecting Factor | 1.25 | Pee Place |
| No. of Gas Stations with Convenience Stores | Performance Affecting Factor | 1.25 | Census |
| Avg. Days of Sunshine | Performance Affecting Factor | 1.00 | Best Places |
| Avg. Inches of Rainfall | Performance Affecting Factor | 1.25 | Best Places |
| Air Quality | Performance Affecting Factor | 1.25 | EPA |
Updated on December 7, 2023 by Joe Kaminski