Pollution from cars is one of the major causes of global warming. Internal combustion engines drink fossil fuels, which are damaging to mine and toxic to refine, and belch out a cocktail of toxins like carbon monoxide, which fill our lungs and deplete our ozone. However, giving up driving, which is woven deeply into American infrastructure and culture, is easier said than done.
Recognizing that the environmental impact of cars doesn’t start on the road but in the factory, where raw materials are made and assembled, we at MRO Electric are passionate about the exodus from gas to electric vehicles (EVs). Running on electricity alone, EVs eliminate the pollution associated with supplying fuel and burning it. Additionally, they’re much cheaper to own since electricity is far more abundant and accessible than fossil fuels.
We hope to see consumers embrace a more sustainable product and believe they will be more likely to if they see the personal financial incentive. To that end, we decided to run a study to determine where eco-conscious drivers can save the most by trading in their gas guzzlers for environmentally friendly electric alternatives.
To do so, we determined the average lifetime miles driven in each state and calculated the lifetime cost of gas and electric vehicles using the cost per gallon of gas and the cost of an eGallon in August 2021. (The eGallon measurement describes the cost to drive a comparable electric vehicle the same distance you could cover on a gallon of gasoline.) With the total cost of running both gas and electric vehicles, we subtracted the two in each state to find out where savings are most pronounced.
The results were shocking! Read on to see what we found.
Key Findings
- No matter where you live, switching to an electric vehicle saves money. While several variables do impact the amount of savings received in each state, all 50 states and the District of Columbia come out ahead after making the switch to electric vehicles.
- You’ll save the most money in Wyoming at $111,167.00 across 1,480,243.5 miles over 62 years. To put that into perspective, that’s an average annual savings of $1,793.00.
- You’ll save the least money in Hawaii at $13,624.00 across 753,876 miles over 65 years. Needless to say, Hawaiians are driving less on their island community, which resulted in an average savings of $209.60 per year.
- The Northeast is where you save the least switching from gas to electric vehicles.
- The American heartland and midwest regions offer top savings for switching from gas to electric vehicles.
- Lifetime miles driven was a key factor in the amount saved from switching to electric cars. The top 10 states that saved the most drive anywhere from 861,984 (Nevada) to 1,480,243.5 (Wyoming) lifetime miles while the top 10 states that save the least drive 615,589.8 miles (Rhode Island) to 872,090.25 miles (Maine) over a lifetime.
The U.S. States Where You Can Save the Most with Electric Vehicles
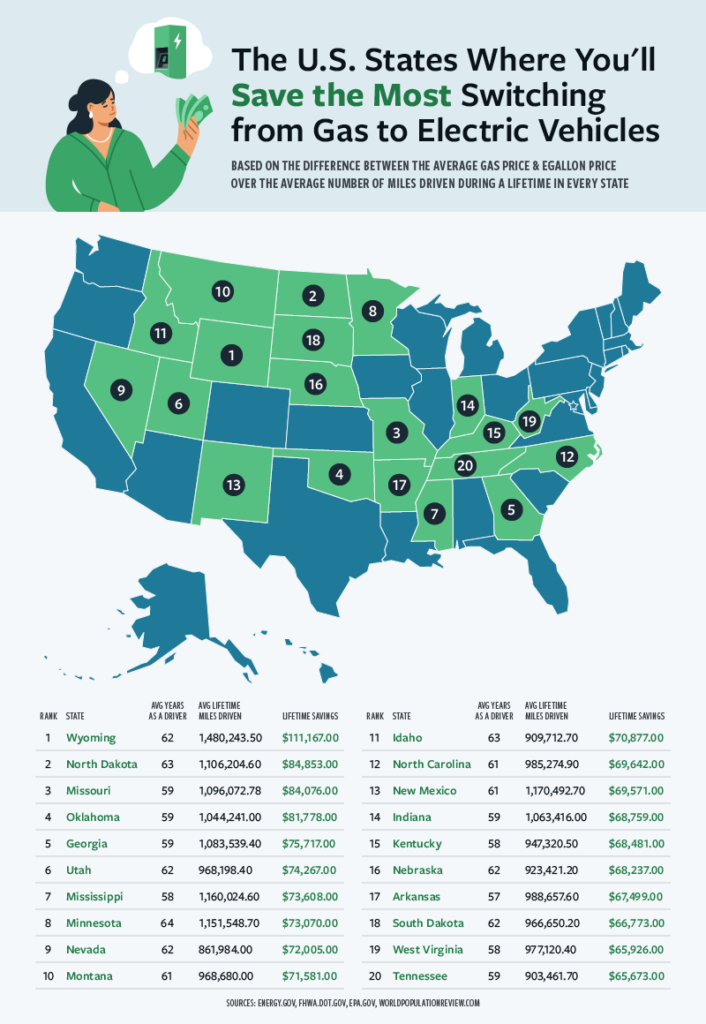
Wyoming drivers save $111,167 over a lifetime of driving electric vehicles instead of gas, which is more than enough to earn the number one ranking position. As residents of the least populous U.S. state, it’s not surprising that Wyoming drivers put more miles behind them than drivers from any other state—24,069 per year on average. Multiplying that by Wyoming’s 62 average years as a driver, Wyoming residents can expect to drive nearly 1.5 million miles in their lifetimes!
With the twelfth highest cost per gallon of gasoline ($2.84) and the thirteenth lowest eGallon cost ($0.97), it’s no wonder Wyoming was poised to all leave other states in the dust. Following Wyoming’s tracks, North Dakota, Missouri, and Oklahoma can save $84,853, $84,076, and $81,778, respectively, by switching to electric vehicles.
See how the top 10 that save the most by switching to EVs stack up below.
The Top 10 States with the Most Savings
- Wyoming
- Lifetime Miles Driven: 1,480,243.50
- Regular Gas Cost: $2.84
- eGallon Cost: $0.97
- Lifetime Fuel Cost Savings: $111,167
- North Dakota
- Lifetime Miles Driven: 1,106,204.60
- Regular Gas Cost: $2.76
- eGallon Cost: $0.85
- Lifetime Fuel Cost Savings: $84,853
- Missouri
- Lifetime Miles Driven: 1,096,072.78
- Regular Gas Cost: $2.76
- eGallon Cost: $0.85
- Lifetime Fuel Cost Savings: $84,076
- Oklahoma
- Lifetime Miles Driven: 1,044,241.00
- Regular Gas Cost: $2.76
- eGallon Cost: $0.81
- Lifetime Fuel Cost Savings: $81,778
- Georgia
- Lifetime Miles Driven: 1,083,539.40
- Regular Gas Cost: $2.72
- eGallon Cost: $0.98
- Lifetime Fuel Cost Savings: $75,717
- Utah
- Lifetime Miles Driven: 968,198.40
- Regular Gas Cost: $2.84
- eGallon Cost: $0.93
- Lifetime Fuel Cost Savings: $74,267
- Mississippi
- Lifetime Miles Driven: 1,160,024.60
- Regular Gas Cost: $2.60
- eGallon Cost: $1.02
- Lifetime Fuel Cost Savings: $73,608
- Minnesota
- Lifetime Miles Driven: 1,151,548.70
- Regular Gas Cost: $2.75
- eGallon Cost: $1.17
- Lifetime Fuel Cost Savings: $73,070
- Nevada
- Lifetime Miles Driven: 861,984.00
- Regular Gas Cost: $3.10
- eGallon Cost: $1.02
- Lifetime Fuel Cost Savings: $72,005
- Montana
- Lifetime Miles Driven: 968,680.00
- Regular Gas Cost: $2.84
- eGallon Cost: $1.00
- Lifetime Fuel Cost Savings: $71,581
The U.S. States Where You Can Save the Least with Electric Vehicles
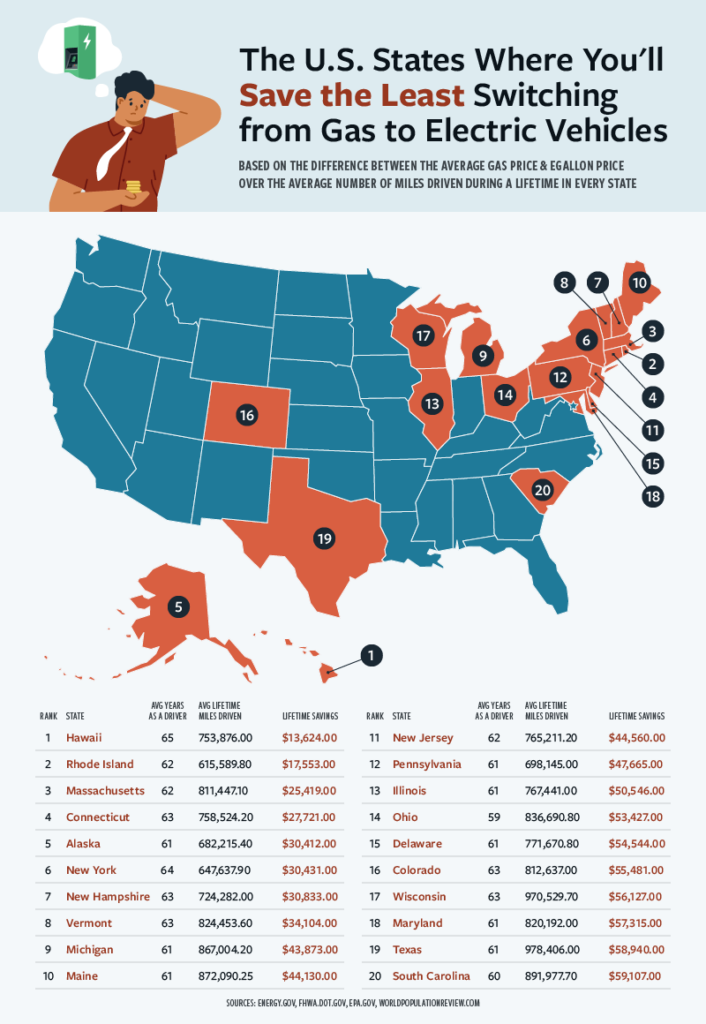
The states that save the least from adopting clean, electric fuel also had one thing in common—they don’t drive as much as the states that save the most. For example, Hawaii, the number one state that saves the least, has an average of 11,598 miles driven per year. Wyoming, the state that saves the most, doubles Hawaii’s annual driving distance with an impressive 23,874.9 miles per year. Overall, Hawaii pockets just $13,624 across an average 65-year driving career.
This trend is seen throughout the rankings, making it clear why some states save more than others. Many of the states on the bottom end of the ranking are known for their dense, tightly packed metropolitan areas where residents have less distance to cover and therefore less saving potential when switching over to electric vehicles. They are perhaps the most important converts for the environment however, with cities being the least efficient environment for internal combustion engines.
In addition, the states on the low end of our ranking pay more per eGallon, further closing the cost gap between running gas and electric vehicles. Hawaii pays the most per eGallon at $2.65, which is more than the amount five states pay for regular gas. After Hawaii, Rhode Island ($2.05), Alaska ($1.99), and Massachusetts ($1.96) pay the highest cost per eGallon and are all in the top five states that save the least by switching to electric vehicles.
See how the top 10 states that save the least by switching to electric compare.
The Top 10 States with the Least Savings
- Hawaii
- Lifetime Miles Driven: 753,876.00
- Regular Gas Cost: $3.10
- eGallon Cost: $2.65
- Lifetime Fuel Cost Savings: $13,624
- Rhode Island
- Lifetime Miles Driven: 615,589.80
- Regular Gas Cost: $2.76
- eGallon Cost: $2.05
- Lifetime Fuel Cost Savings: $17,553
- Massachusetts
- Lifetime Miles Driven: 811,447.10
- Regular Gas Cost: $2.74
- eGallon Cost: $1.96
- Lifetime Fuel Cost Savings: $17,553
- Connecticut
- Lifetime Miles Driven: 758,524.20
- Regular Gas Cost: $2.76
- eGallon Cost: $1.85
- Lifetime Fuel Cost Savings: $27,721
- Alaska
- Lifetime Miles Driven: 682,215.40
- Regular Gas Cost: $3.10
- eGallon Cost: $1.99
- Lifetime Fuel Cost Savings: $30,412
- New York
- Lifetime Miles Driven: 647,637.90
- Regular Gas Cost: $2.83
- eGallon Cost: $1.66
- Lifetime Fuel Cost Savings: $30,431
- New Hampshire
- Lifetime Miles Driven: 724,282.00
- Regular Gas Cost: $2.76
- eGallon Cost: $1.70
- Lifetime Fuel Cost Savings: $30,833
- Vermont
- Lifetime Miles Driven: 824,453.60
- Regular Gas Cost: $2.76
- eGallon Cost: $1.73
- Lifetime Fuel Cost Savings: $34,104
- Michigan
- Lifetime Miles Driven: 867,004.20
- Regular Gas Cost: $2.76
- eGallon Cost: $1.50
- Lifetime Fuel Cost Savings: $43,873
- Maine
- Lifetime Miles Driven: 872,090.25
- Regular Gas Cost: $2.76
- eGallon Cost: $1.50
- Lifetime Fuel Cost Savings: $44,130
Follow the Money
The following interactive line chart animates the increase in savings over time for every state. How does your state stack up? Mouse over each line for more details and click “replay” to watch the race again.
Final Thoughts
A major trend percolating throughout the rankings is that driving more equates to saving more. This makes sense because the magnitude of savings from electricity as an alternative fuel is tied to each mile driven. The more you drive and don’t pay for gas, the more you save.
Savings are also affected by total years as a driver, cost of gasoline, and cost of electricity. But of these three variables, the cost of electricity had the largest effect on potential savings. Interestingly, there was a roughly inverse relationship between the number of miles driven and the cost of an eGallon, meaning the states that drive less also pay more for electricity.
Notably, every state saved money by switching to electric vehicles. Whether saving $209.60 per year in Hawaii or $1,793.02 per year in Wyoming, electric vehicles are beneficial for the environment and lighter on consumer wallets. There isn’t anything we can do to completely reverse the effects of global warming, but we can correct our course by adopting cleaner fuel sources.
At MRO Electric, we know the environmental impact of each vehicle begins in the factory, and we are committed to increasing manufacturing efficiency through factory automation. Whether your factory contributes to the EV industry or not, we have the parts you need to automate outdated processes and the know-how to repair malfunctioning equipment fast.
Methodology
MRO Electric collected life expectancy and legal driving age from World Population Review and subtracted the two to determine average years as a driver in each state.
The average miles driven in each state was collected from the Department of Transportation and the national average fuel efficiency was collected from the Environmental Protection Agency. Using these figures, MRO Electric determined the average number of gallons consumed over a lifetime of driving in each state.
This was multiplied by the average cost of gas and eGallon cost per state (collected from the Department of Energy) to determine the total cost of driving a gas and an electric vehicle in each state. Finally, we subtracted these two cost numbers to arrive at the lifetime savings from switching from gas to electric vehicles in each state.
Because gas prices can fluctuate seasonally, it is important to note that all data was collected in July, 2021.
Updated on August 17, 2021 by Admin GoFishDig