Joe Kaminski is an industrial automation specialist at MRO Electric. He has a background in industrial engineering and supply chain management. Joe has worked in the automation industry for over 10 years providing support to some of the largest companies in the world. For more info, visit www.mroelectric.com.
In the ever-evolving landscape of manufacturing and industry, automation has emerged as a transformative force. As we step into the year 2024, the world of industrial automation is more exciting and promising than ever before. This blog post explores the latest trends, innovations, and the impact of industrial automation in 2024.
The Evolution of Industrial Automation
Industrial automation has come a long way since its inception. It began with simple mechanization processes in the early 20th century, gradually transitioning to numerical control systems, and eventually embracing computerization and robotics. Today, it’s at the cusp of a new era, driven by cutting-edge technologies like artificial intelligence (AI), the Internet of Things (IoT), and advanced robotics.
Automation Trends in 2024
AI-Powered Robotics: In 2024, we are witnessing a significant rise in AI-powered robots that can handle complex tasks with precision and adapt to changing conditions. These robots can learn from experience, making them invaluable assets in manufacturing processes.
IoT Integration: The integration of IoT devices into industrial automation systems continues to grow. Smart sensors and connected machines enable real-time monitoring, data collection, and predictive maintenance, reducing downtime and enhancing overall efficiency.
Augmented Reality (AR) and Virtual Reality (VR): AR and VR technologies are making their way onto the factory floor, aiding in training, maintenance, and remote support. Workers can wear AR glasses to receive real-time information and instructions, improving productivity and safety.
5G Connectivity: The rollout of 5G networks has accelerated the adoption of automation. The low latency and high bandwidth of 5G enable seamless communication between machines, robots, and control systems, even in large-scale industrial settings.
Collaborative Robots (Cobots): Cobots are becoming increasingly prevalent. These robots can work alongside humans safely and efficiently, offering a solution to labor shortages while maintaining high precision and quality.
Autonomous Vehicles: Autonomous vehicles are transforming logistics and material handling within industrial environments. Self-driving forklifts and drones are streamlining warehouse operations, reducing costs, and minimizing human error.
Machine Learning and Predictive Analytics: Advanced machine learning algorithms are being used to analyze vast amounts of data generated by automation systems. This allows for predictive maintenance, quality control, and process optimization.
This holiday season, it isn’t Santa who does all the work behind the scenes— it’s your city’s delivery drivers! Delivery drivers are the vital link between online clicks and the gratifying thump of a package arriving on the doorstep. Whether it’s that last-minute gift for the in-laws or more holiday decor, they’re the unsung heroes who make it happen. Yet, the delivery driving experience can differ dramatically from one city to the next.
We put 100 U.S. cities under the microscope, examining factors like hourly wages, road conditions, availability of public restrooms, and more to discern where your presents will be delivered with ease and where drivers will struggle most to play Mr. Claus. Curious about where your city stands? Buckle up, and let’s hit the road!
If “fear” is not in your vocabulary and “danger” is your middle name, storm chasing may be right up your alley. For individuals who are fearless enough to add “Storm Chaser” to their resume, MRO Electric determined the best states to keep a pulse on hurricanes, tornadoes, and tropical storms in the country.
In this study, we ranked the top 50 states across the country to chase cyclones based on several factors, including the number of tropical storms, hurricanes, and tornadoes within the past 5 years, average nightly price of temporary accommodations, average travel expenses, and more. Read on to find out if you’re in a hotspot for hurricanes or if you’ll have to venture a little further out to enter the eye of the storm.
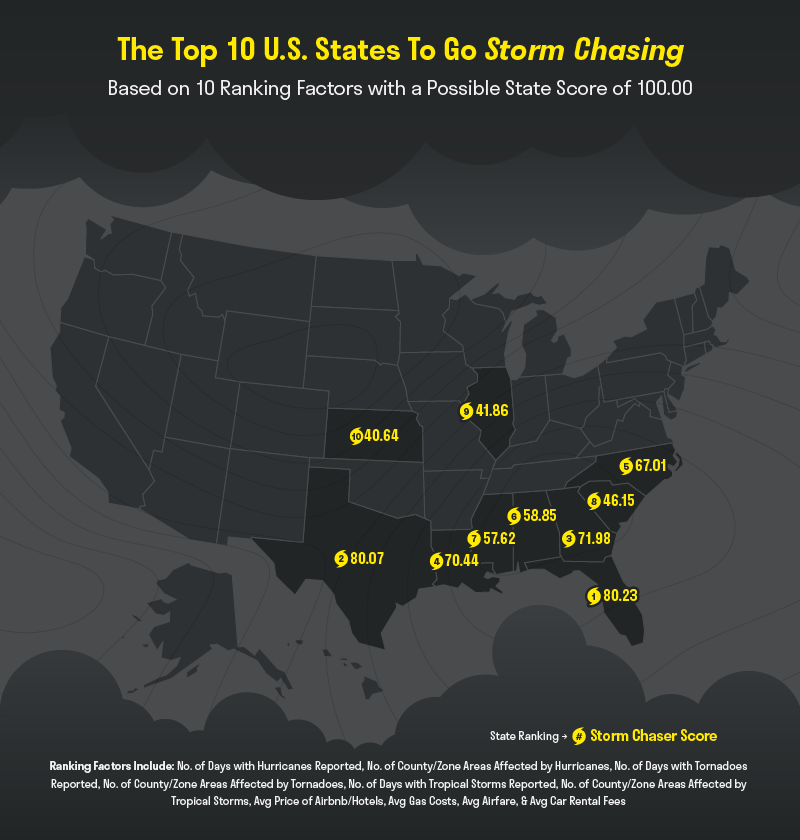
Taking the Nation by Storm: The 10 Most Turbulent States
Storm chasers looking for a chance to be in the middle of the action should plan a trip to the southern and southeastern regions of the U.S. Our friends down south made up 8 of the top 10 states, making it the place to be for storm chasers all over the nation.
Florida is undoubtedly the place to be for any aspiring storm chaser. The Sunshine State comes in first on our list with a storm chaser score of 80.23. Florida reports more days of tropical storms than any other state in the country and frequently faces other natural disasters, like hurricanes and tornadoes. Average airfare to Florida is also cheaper than any other U.S. state, making it accessible to storm chasers who plan on trekking from parts unknown to catch a glimpse of the carnage.
If you feel tempted to chase after terrible tornadoes, your best bet might be to travel to Illinois or Kansas. These two states are the only states in our top 10 not located in the southern or southeast part of the country. Interestingly, they are also the only states in our shortlist to have reported impacts by only one of the storm types. Their impact from tornadoes being so exceptionally high was enough to put the pair in the top 10.
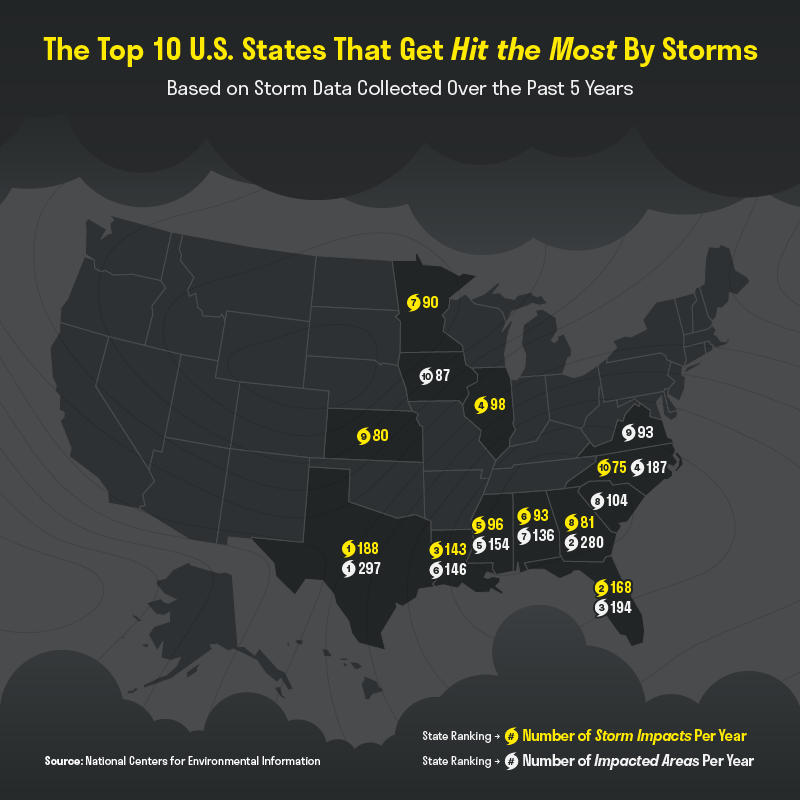
The Danger Zone: States That Get Hit the Most
Texas had the highest number of storms at nearly 200 impacts in the past five years alone. When it comes to the sheer number of natural disasters, no one else comes close to touching the Lonestar State. In five years, Texans have had to grapple with 158 days of tornadoes, 7 days of hurricanes, and 12 days of tropical storms. If you’re a veteran storm chaser looking for a challenge, remember everything’s bigger in Texas.
Even though Illinois doesn’t even receive a gold, silver, or bronze medal for states most frequently hit by storms, it definitely deserves an honorable mention. With only reporting impacts from one of the three storm types, it is the 4th state overall to get banged up regularly by storms. In just five years, it has reported nearly 20 tornadoes on average a year.
Though Texas was the state to experience storms the most frequently beyond any doubt, Georgia takes a surprising second for most areas hit by storms. Geographically, Georgia shares borders with four states on our top 10 states with the most areas hit by storms list. Residents in Georgia have to deal with disasters coming from every direction since Alabama, Florida, North Carolina, and South Carolina are more than happy to share some of the action with them.
Closing Thoughts
If you’re no stranger to danger and love the thrill of hunting down disaster, storm chasing might be the perfect hobby for you. Storm chasers who are up for a challenge and a little traveling should head down south if they really want to test their mettle against some of the country’s most terrifying storms and natural disasters. Just remember to keep safety and the cost of accommodation in mind.
Storms pop up in various regions and cause disruptions to our natural way of living. Storm chasers are crucial in tracking the patterns and reporting the conditions of these storms. More often than not, one common occurrence with these harsh weather conditions is power outages across hundreds of neighborhoods. That’s why MRO Electric is committed to ensuring people across the country have access to trustworthy electric and power systems they can depend on during an emergency.
Full Data
That wraps up our state ranking for The Best States for Storm Chasers. Interested in diving deeper into the numbers for all of the states, or wanting to see how your state stacks up if it’s not listed within the above map?
We’ve compiled our full data study for all 50 U.S. states and the District of Columbia analyzed into the interactive data table below. Search for the state you call home or click on the heading of each column to sort by that category!
Methodology
To find out the best states for storm chasers, we began with a list of all 50 of the U.S. states and the District of Columbia. We collected data on 10 factors that pertain to or impact storm chasers. We assigned states with a score of 0-5 for each factor, with a score of 5 representing the most favorable conditions. We determined each state’s total score from the total of its individual factor scores, which were weighted according to their impact on storm chasers. Individual factor scores were then added together to give each state a final score from 0-100. Higher scores indicated states that are better for storm chasers. Details on our ranking factors can be found below.
Ranking Factor
Weight
Source
Number of Days with Hurricanes Reported (in last 5 yrs)
There’s nothing more thrilling than attending a sporting event to watch your favorite team take on a tough opponent. Home games are a blast, but traveling to a new city to watch your team can be an equally exhilarating experience. For fans, traveling for one game can be a whirlwind to plan, but athletes are traveling multiple times a week – especially hockey players.
NHL players have many games a week, and several teams are based outside of the U.S., meaning they spend a lot of time on the road during the season. There’s a lot that goes into getting your favorite players on the ice on time. On average, your favorite NHL team travels nearly 50,000 miles per season!
For this study, MRO Electric’s resident hockey fanatics analyzed how many miles each team is slated to travel based on the upcoming season.
Methodology
To gear up for hockey season (and for this study), we reviewed each team’s schedule on ESPN to see where everyone will skate off to. Next, we used Google Maps to calculate the mileage between each hockey game of the 2022-2023 season for every team in the league. This study assumes that each NHL team is driving to and from each game and doesn’t need to travel elsewhere for personal reasons. We measured the travel time back to home ice, meaning that if a team spent multiple games on the road, we calculated the distance between each venue on the road and then the trip home. Finally, we found which teams travel the most and which individual games require the most miles to get from point A to point B.
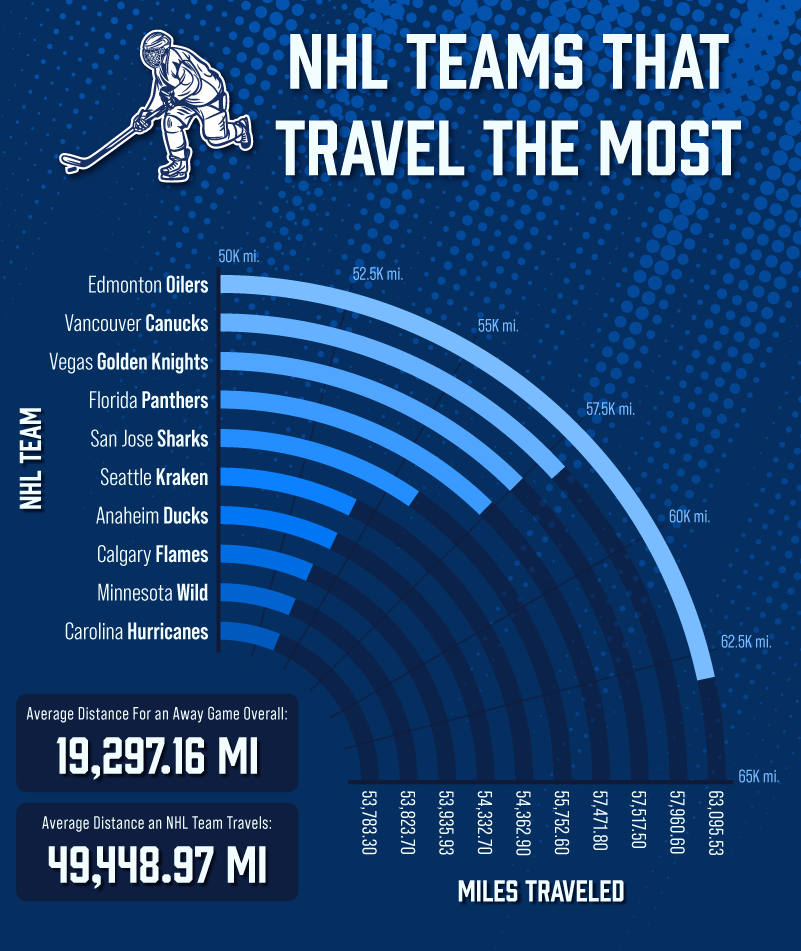
Top 10 NHL Teams Traveling the Most Miles in 2022-2023 Season
If your favorite hockey team is a part of the pacific division, chances are your star players are traveling far and wide to push the puck. Pacific division NHL teams account for seven of our top 10 most traveled teams. The majority of teams in this division have at least a handful of games that require trekking over 2,000 miles and several more that clock in at just over 1,000 miles. Not only that, but the league’s average distance for an away game overall is just over 19,000 miles. Talk about going the distance!
The most well-traveled team in the league is Edmonton’s own Oilers. The Oilers claim the unofficial title of the NHL’s top road warriors, traveling over 5,000 more miles than any other hockey team in any division. The Edmonton Oilers have nine games that require them to travel 2,000 miles or more to get to. Oiler fans in the Sunshine State who support them on November 12th will have traveled nearly 3,000 miles to get there.
Another Pacific dream team to go the distance is the Anaheim Ducks. On October 18th, Anaheim’s beloved Ducks travel over 2,000 miles to face off against the New York Islanders. New York is a fighting city and the Anaheim Ducks are a tough bunch to tussle with. Fun fact: these mighty mallards came in second place last season for most fights on the ice. Can you blame them though? Any hockey team that is jet-lagged is bound to be a little crabby.
Many of the league’s east coast teams have the luxury of being some of the least-traveled hockey teams, but one unlucky franchise has to hit the road more than the others. The only team in the NHL’s metro division to make our top 10 list was the Carolina Hurricanes. Caniacs (that’s Carolina-speak for huge Hurricanes fans) have to travel nearly 2,800 miles from Raleigh to San Jose to support the Cardiac Canes at their most distant away game of the season.
Hitting the Road: Games with the Highest Mileage
Teams on the road travel great distances to compete against each other on enemy territory. Many teams in the league will have a few consecutive games away from having home-ice advantage. Not only is it tough to be away from home for extended periods of time, but it’s even worse when you’re getting booed for being on the wrong team.
If you ever question your favorite team’s commitment to the game, consider that the distance the NHL would travel as a whole this season would take you around the globe 63 times and from LA to NY 569 times! Truthfully, NHL teams go through many hoops to play their hearts out game after game. For fans wondering how far their teams will go to put on a good show, here’s a closer look at some games that require the most travel from rink to rink.
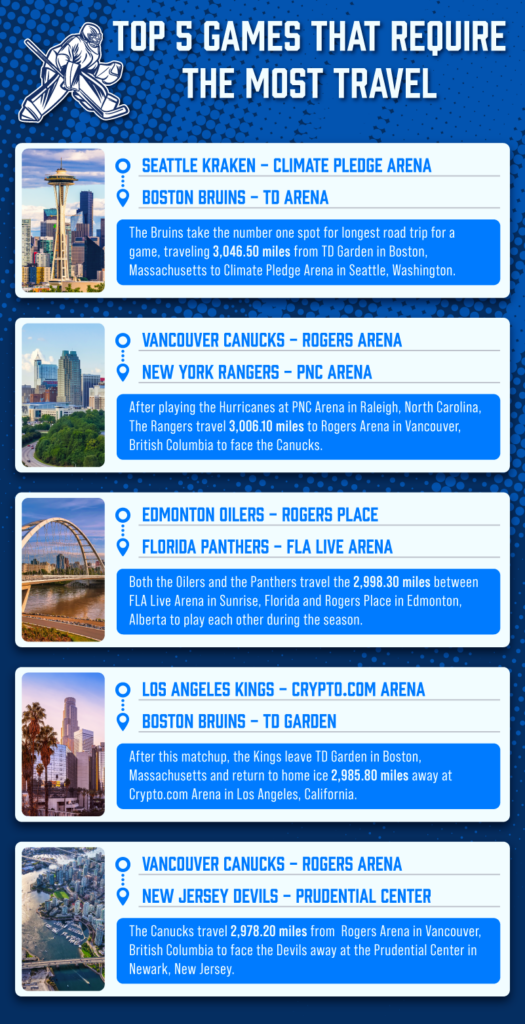
We’re certain that the New York Rangers will not be feeling the love during Valentine’s day week this hockey season. The Rangers have to travel just over 3,000 miles after rallying against Raleigh’s Carolina Hurricanes to face off with the Vancouver Canucks on February 15th. That’s a lot of pressure– winning against the Canucks could mean breaking a few fans’ hearts in Vancouver. Oh well, all is fair in love and hockey.
The most gas-guzzling NHL game of the regular season takes place in the Emerald State, where the Boston Bruins will take on the Seattle Kraken. The Bruins will have to travel a total of 3,006 miles to take a shot at Seattle. The only two hockey games on our list of games with the highest mileage not involving our friends in the Great White North both feature Boston in some way. In December, the Los Angeles Kings will journey 2,985 miles to square off with the Bruins in Bean Town.
Closing Thoughts
Whether your favorite hockey team has the home-ice advantage or not, cheering them on against a fierce competitor can be an emotional whirlwind. The truth is, your commitment to your favorite team means a lot to them– especially when they’re in enemy territory. NHL hockey players travel between cities and sometimes countries multiple times a week to make it to the game. There are many moving parts that go into making sure your favorite players safely get from venue to venue, so consider that next time you cheer them on against a tough rival team!
In the same way, your favorite NHL team has a lot of moving parts and players, your business needs a solid system and plan to make it all happen. As a premier factory automation wholesale distributor, MRO Electric can help your business by working with the best manufacturers to get you the best parts to get the job done.
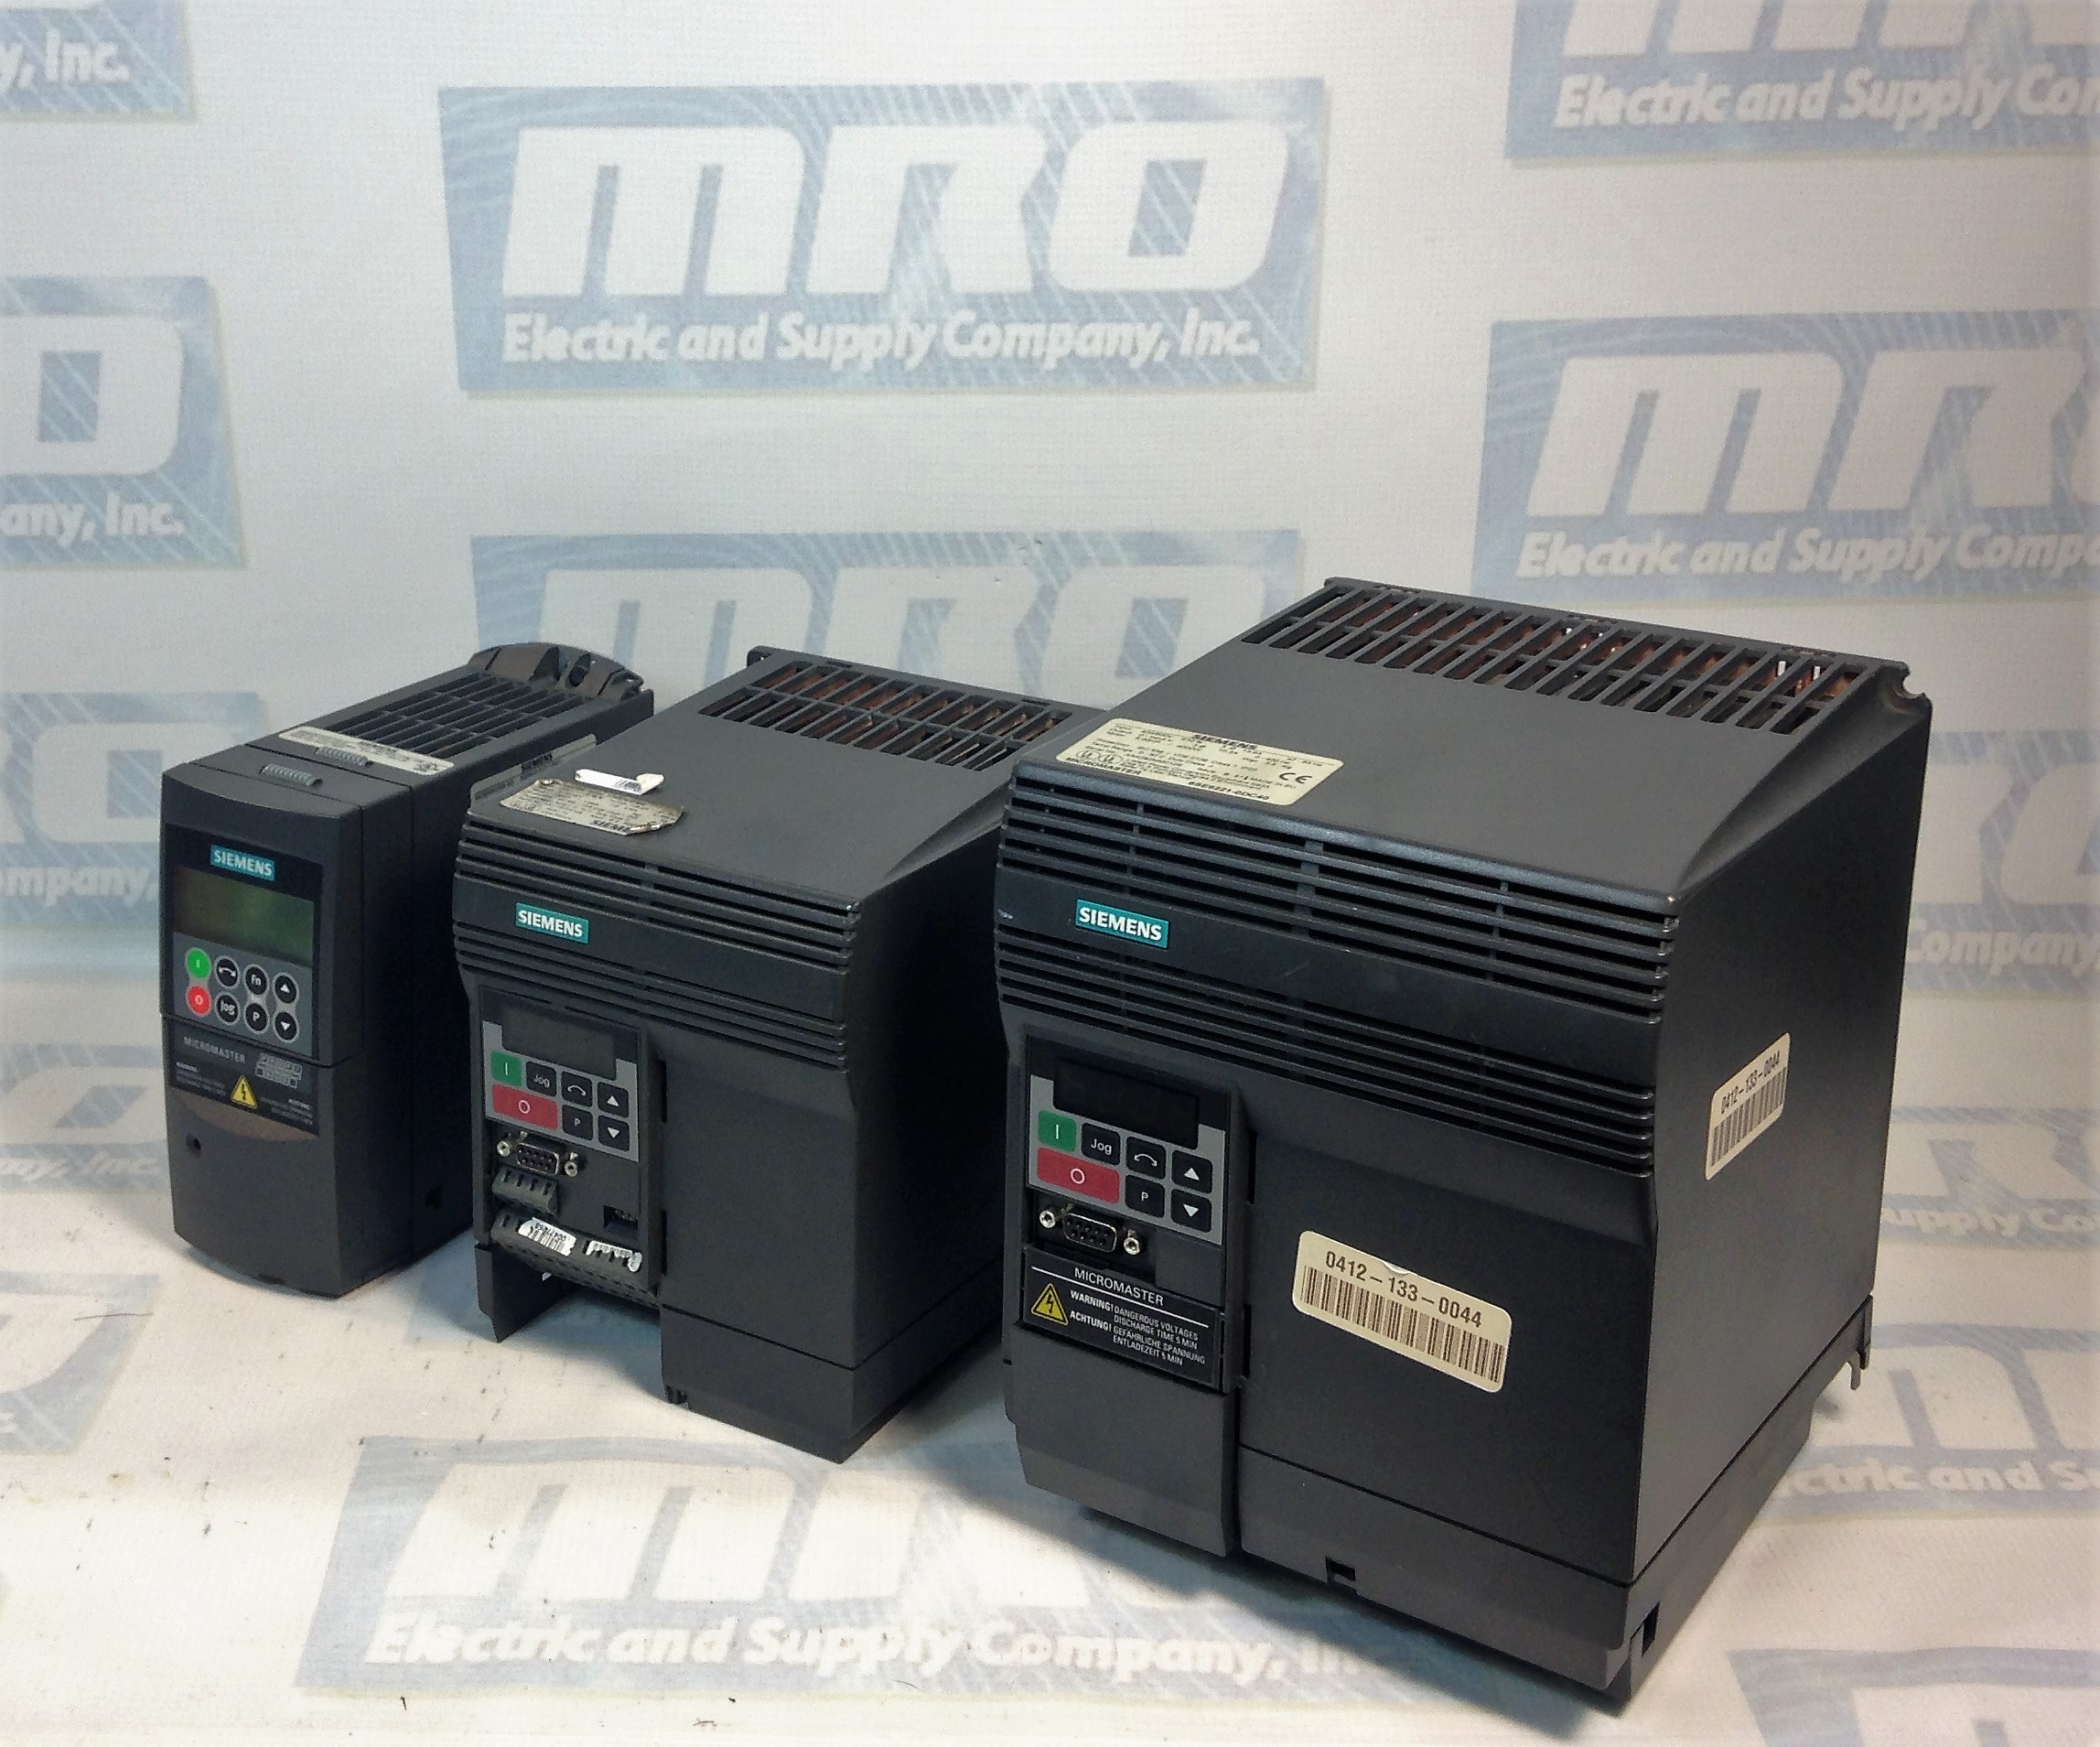
Siemens Micromaster 420: Troubleshooting Faults and Alarms
A blog we posted earlier this week about the Micromaster 420 troubleshooting referenced the Faults and Alarms list for the Micromaster series, so we decided that it would make sense to make the list of Micromaster 420 Faults and Alarms directly available. This is from the corresponding manual for the Micromaster 420 series, but it is buried within the manual which most people most likely don’t even have. Hopefully, this helps with your troubleshooting of Siemens drive fault codes and alarms.
If you’re looking to purchase a Siemens Micromaster drive, view our 420 Micromaster Drives in stock. For more information or to request a quote, please call 800-691-8511 or email sales@mroelectric.com. We also provide pre-priced Micromaster 420 Repairs.
With no ceiling in sight for the climbing gas prices around the nation, many Americans are forced to adjust both their driving and spending habits to keep pace. Plus, with the holiday season in full swing, Americans need to account for higher airfare, food costs, and hotel prices as they plan their vacations, which may mean trips closer to home. Gone are the days of purchasing gas for under $2.00 per gallon. We now live in an era, where the price per gallon exceeds the federal minimum wage in certain locations––talk about pain at the pump.
Minimum wage workers and low-income commuters are suffering the most as a large percentage of their paychecks are being ravaged by rising gas prices. In California, a 12-gallon tank of gas costs minimum wage workers in some areas nearly 57% of a day’s pay. In some states like Pennsylvania and Utah, gas prices continue to rise, while minimum wage still sits at $7.25 an hour––where it’s sat for the last ten years, despite growing inflation rates.
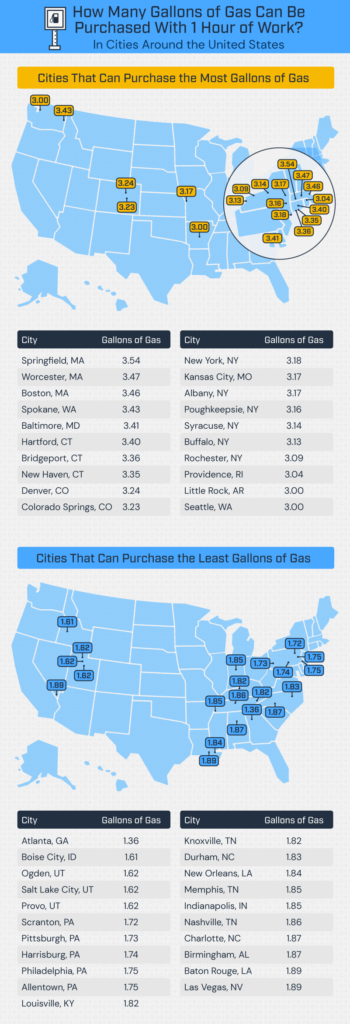
To uncover where soaring gas prices are taking the biggest bite out of workers’ paychecks, MRO compared the minimum wage to the mean gas price in 100 U.S. cities. We dug deeper, focusing on 18 cities where gas costs over 80% of a minimum wage employee’s paycheck, ushering in a dystopian-like society all over the U.S. Read on to see where your city and state stack up.
What Causes Gas Prices to Go Up?
Low prices at the pump in our pre-pandemic world weren’t just a fever dream. If you remember, the demand for oil drastically fell during the pandemic as the world shut down and people were forced to stay home, but as the U.S. slowly started to recover, the demand for oil rebounded once more. The only problem? Oil production came to a grinding halt and drilling new oil wells takes a lot longer than ordering a new outfit through Amazon Prime. Plus, inflated energy prices, transportation costs, and a U.S. ban on purchasing oil from Russia all factor into soaring oil costs.
Why Is the Minimum Wage so Low?
The minimum wage was last raised thirteen years ago to $7.25 per hour on July 24, 2009, and it’s no secret that this amount has not kept up with inflation. Certain places like New York City have taken steps to raise the minimum wage for fast food workers to $15.00 per hour, but not every state and city has followed suit, leaving many wondering how they can survive and stretch their paychecks.
The minimum wage is indexed in 18 states and adjusts to keep up with inflation, but even this can vary depending on the individual counties within the same state. While President Biden did use executive order privileges to raise the minimum wage to $15.00 per hour for federal workers, republican and democratic lawmakers still can’t reach a resolution that satisfies either party’s agenda. With other pressing matters coming to a head, it’s not clear when or if a raised minimum wage that accounts for the rising cost of living will ever be ratified into law in the near future.
Can Minimum Wage Workers Afford the Gas Prices for Their Commute?
According to study results, minimum wage workers who make $5.15 per hour in Atlanta, GA pay $3.80 on average for a gallon of gas, resulting in 110.6% of a day’s paycheck being eaten by a full tank of gas (12 gallons). If the average commute in the U.S. requires 1.28 gallons of gas, then these Atlanta workers would lose wages just by showing up to work.
A full tank of gas consumes 93.1% of a day’s pay in cities like Boise City, ID, and it isn’t much better in places like Salt Lake City, UT, where 92.3% of a hard earned day’s wages is budgeted towards a full tank of gas. Those in Philadelphia, PAlose out on 85.9% of their paycheck towards a full tank. Minimum wage workers are stuck in a catch-22, but certain restaurant owners in Philadelphia are promising to raise their hourly wage to $15 per hour, creating light at the end of the tunnel.
Some customers are willing to pay higher menu prices to accommodate a living wage, and with the City of Brotherly Love welcoming 36.2 million visitors in 2021 alone, let’s hope this hot spot tourist destination can back these restaurant owners’ selfless initiatives.
Out of the top 18 cities where gas costs over 80% of a minimum wage worker’s paycheck, Pennsylvania holds five of those seats in places like Scranton (87.3% of a day’s pay), Pittsburgh (86.9% of a day’s pay), Harrisburg (86.4% of a day’s pay), and Allentown (85.5% of a day’s pay). The oil refinery explosion that occurred in South Philly in 2019 has forced the state to rely on imports more than ever before, contributing to the rising cost of gas.
Popular tourist destinations like New Orleans, LA, and Memphis, TN, are seeing skyrocketing gas prices at the pump. New Orleans minimum wage workers sacrifice 81.7% of a day’s pay to a gallon of gas while Memphis workers follow closely behind at 81.0%. Taking a trip to day drink at New Orleans’ historic bars? Avoid soaring gas prices and careen around the city on foot or with their bike share program.
The 5 States With the Largest Difference Between Minimum Wage and Average Gas Prices
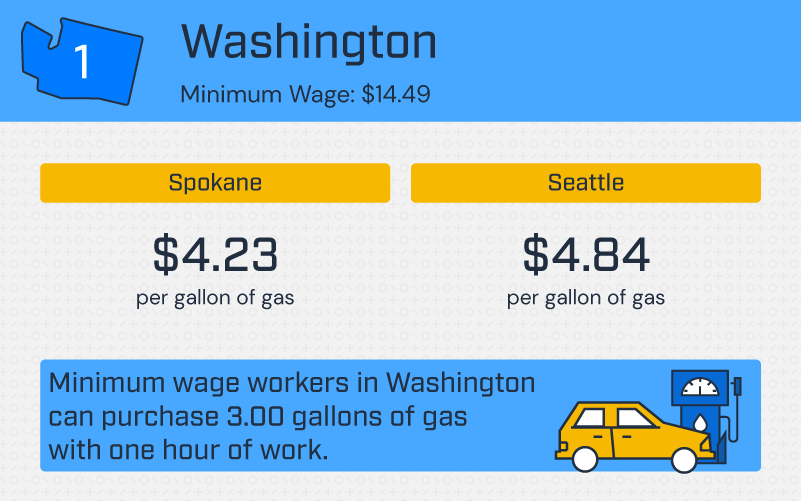
Washington
Next, we found the five states with the largest difference between minimum wage and average gas prices. Topping the list is Washington state. With a minimum wage of $14.49 and the average price per gallon of gas at $4.23, minimum wage workers in Spokane, WA can purchase 3.43 gallons of gas with one hour of work. Minimum wage workers in Seattle, WA can purchase 3.00 gallons of gas with one hour of work. What’s more, a full tank of gas (12 gallons) costs minimum wage workers in Seattle, WA 50.1% of their pay that day.
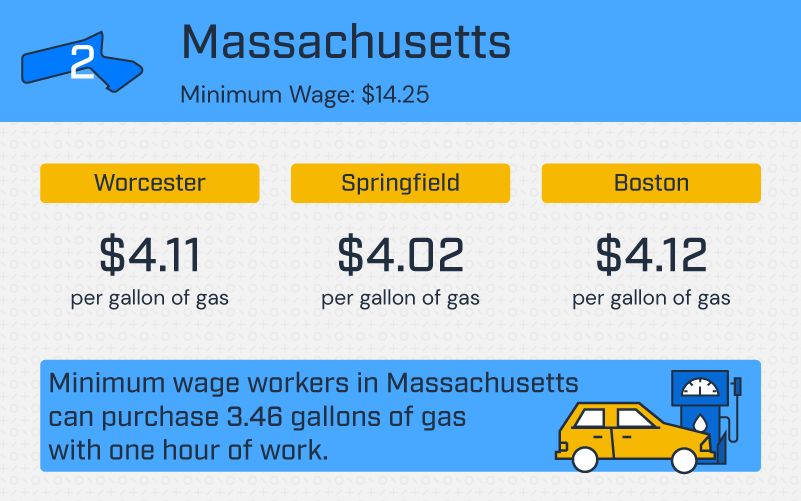
Massachusetts
With a minimum wage of $14.25 and the average price per gallon of gas at $4.12, minimum wage workers in Boston, MA can purchase 3.46 gallons of gas with one hour of work. Additionally, a full tank of gas costs minimum wage workers in Boston, MA over 43% of a day’s pay.
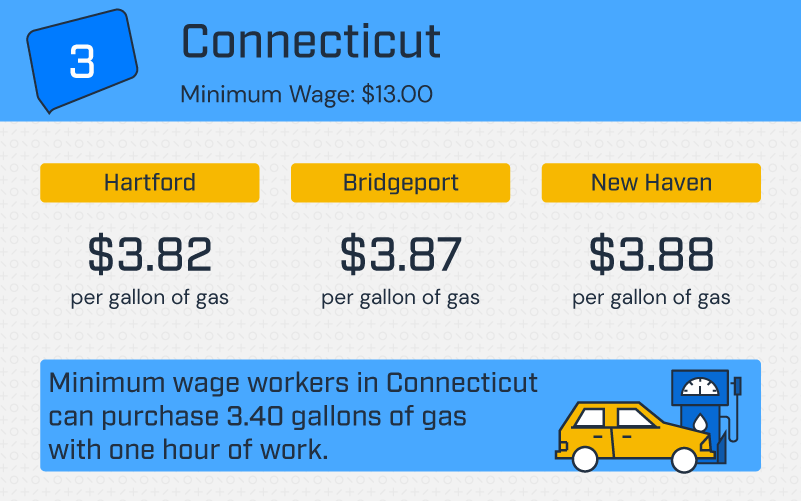
Connecticut
In Connecticut’s capital, Hartford, minimum wage workers can purchase 3.40 gallons of gas with one hour of work. In New Haven, CT, home of Yale University, that number drops to 3.35 gallons. Therefore, a full tank of gas costs minimum wage workers in Hartford and New Haven nearly 45% of a day’s pay.
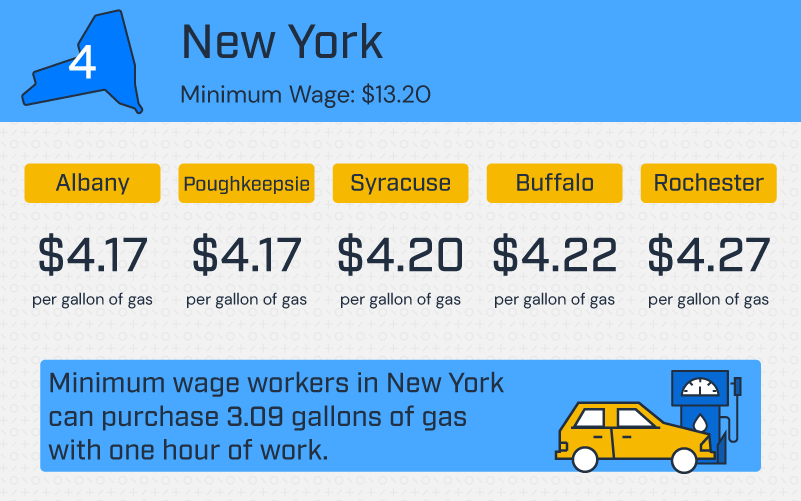
New York
With a minimum wage of $13.20 and the average price per gallon of gas at $4.27, minimum wage workers in Rochester, New York can purchase 3.09 gallons of gas with one hour of work. Minimum wage workers in Buffalo, NY, and Albany, NY could purchase 3.13 and 3.17 gallons of gas, respectively.
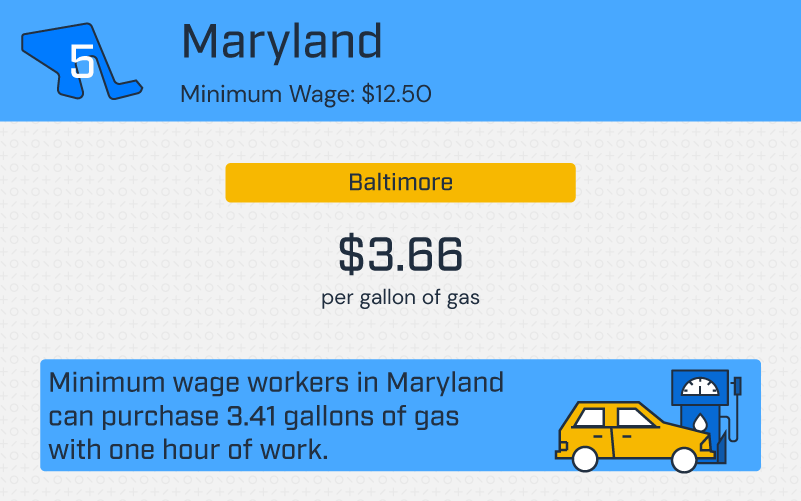
Maryland
In Baltimore, MD, minimum wage workers can purchase 3.41 gallons of gas with one hour of work. Additionally, a full tank of gas costs minimum wage workers in Baltimore almost 44% of their pay that day.
Are There Any Signs of Relief on the Horizon for Minimum Wage Employees?
While minimum wage workers protest all over the country to get their voices heard, they still face an upward battle in this ongoing fight, despite there being a majority of Americans who are in favor of raising the minimum wage to $15.00 per hour. Governors in certain places like Pennsylvania are putting pressure on the General Assembly for a living wage and relief for their constituents. One survey found that while Republicans do agree the minimum wage should be increased, most would prefer raising it to $11.00 per hour, instead of $15.00. As states, cities, and local counties possess the authority to raise the minimum wage, this fight may need to be taken to the lower levels of power, instead of advocating for a living wage on a national scale, where it may find less success.
Gas Prices and Stagnant Minimum Wages Continue to Affect Consumers
That wraps up our study, comparing gas prices to minimum wage amounts around the U.S. Gas prices continue to be a dire issue across the country in 2022, as well as a harrowing expense for lower-income Americans who are also struggling to keep up with rising food prices and housing costs.
While MRO Electric can’t control the cost of gas, we can offer the parts and equipment you need to keep things getting from A to B. Get in touch with us today by emailing sales@mroelectric.com or calling us at 800-691-8511 for a quote.
Research Methodology
Using data from the U.S. Department of Labor and GasBuddy, we collected the minimum wage in each state and the mean gas price in 100 U.S. cities in April 2022. We divided the minimum wage in each state by the average gas price in each city to determine how much gas a minimum wage worker can purchase with one hour of work. For all minimum wage amounts by state, we collected the basic minimum rate per hour, as listed by the Department of Labor. Gas prices are always fluctuating, so prices may differ from the time frame the data was pulled.
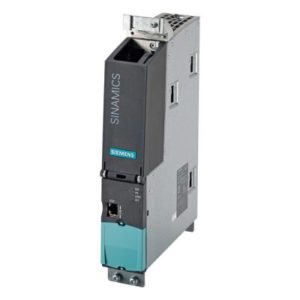
These multi-drive Control Units increase axis count and functionality. They have an Ethernet port, as well as more I/O and controller to controller communication. Each unit can manage up to 6 servo or vector axes in a high performance system. For standard systems, up to 12 V/Hz axes can be controlled from one CU320-2 unit. These Control Units significantly reduce system costs, as they increase functionality for positioning, safety integration, and drive control allowing all these functions to be controlled by one unit versus several.
Siemens CU320 control units also provide additional flexibility with a high number of programming options and digital inputs. With up to 12 binary inputs, the modules’ high I/O count add ease of use. The additional Ethernet port expands programming options as well. Overall, the CU320-2 control units allow for simple yet flexible performance with minimal cost and space requirements.
If you want to learn more about these high-performance drives, check out our blog on Sinamics s120 fault codes.
CU320-2 DP Module
The CU320-2 DP is a Sinamics Control Unit with a Profibus interface. It is a central Control Module in which the closed-loop and open-loop functions are implemented for one or more Line Modules and/or Motor Modules. It can be used with firmware version 4.3 or greater. It has 12 digital inputs, 8 digital inputs/outputs, 4 DRIVE-CLiQ interfaces, a Profibus and Ethernet interface, a serial interface (RS232), an option slot, and 3 measuring sockets.
MRO Electric stocks new and refurbished CU320-2 DP Control Units, which is part number 6SL3040-1MA00-0AA0. If you would like a replacement module, please call 800-691-8511 or email sales@mroelectric.com.
CU320-2 PN Module
The CU320-2 PN is a Sinamics S120 Control Unit without a Profibus interface. It has the same interfaces as described above, however without the Profibus port. It is also a central control unit with closed-loop and open-loop functions that can be implemented for one or more Line or Motor modules.
MRO Electric stocks new and refurbished CU320-2 PN Control Units, which is part number 6SL3040-1MA01-0AA0. If you would like a replacement module, please call 800-691-8511 or email sales@mroelectric.com.